This week’s SaaS Barometer Newsletter is brought to you by SaaS Metrics Palooza 2024. Come join 30 of the SaaS industry’s top leaders as they share the latest in how leading companies are using metrics and benchmarks to inform decisions, achieve efficient revenue growth and maximize enterprise value creation for every stakeholder
SaaS Magic Number is not MAGIC
“What does it really tell and not tell you”
What is the history of the SaaS Magic Number? While evaluating Omniture for an investment in 2005, Scale Venture Partners Rory O’Driscoll was analyzing the company’s revenue growth relative to its Sales & Marketing expenses.
When he discovered they were generating more than two dollars of growth for every dollar invested in their go-to-market engine, he exclaimed, “It’s Magic!”. Soon afterwards, the SaaS Magic Number became a popular metric across the industry to measure a SaaS company’s revenue growth efficiency.
But is the SaaS Magic Number “MAGIC”? For investors, this compound metric is an easy way to understand if a company is efficient in their Sales and Marketing investment as measured against revenue growth.
However, when measuring the impact of the SaaS Magic Number on Enterprise Value to Revenue multiples, the correlation as measured by R-Squared is only .07 as compared to the Rule of 40 with an R-Squared value of .28 (4x more correlated).
The rest of this newsletter is dedicated to discussing why the SaaS Magic Number is not magic for SaaS executives and operators to understand where they need to prioritize their focus to increase growth efficiency. It will end with suggestions that have appeared in previous editions of the SaaS Barometer.
SaaS Magic Number Calculation
The SaaS Magic Number calculation appears simple on the surface - but is more nuanced than meets the eye:
Traditional wisdom segments the SaaS Magic Number result into the following ranges:
< .75 → Inefficient
.75 - 1 → Moderately Efficient
> 1 → Highly Efficient
SaaS Magic Number Formula Nuances
Nuance #1: GAAP Revenue not ARR
The original Scale Venture Partners formula used GAAP revenue because they realized that ARR was not an accounting standard and thus is calculated differently across companies😢
By using ARR it would be more difficult to benchmark the SaaS Magic number for every company in their portfolio and even more difficult across the industry.
Nuance #2: Quarter over Quarter Change in GAAP Revenue is Multiplied by 4
Since the early days of SaaS, especially after the industry (thank you Salesforce) began the transition from monthly subscriptions (MRR) to annual subscriptions (ARR), a common thesis for investing in a recurring revenue SaaS business was due to the increased predictability of revenue quarter over quarter.
Scale wanted to “approximate” quarter over quarter GAAP revenue growth to ARR. To accomplish this, they multiplied the quarterly growth in GAAP revenue by four (4) to create an estimated ARR growth number. This is similar to how financial analysts calculate “Implied ARR” for publicly traded SaaS companies by multiplying current quarter GAAP revenue times four.
Nuance #3: Sales and Marketing Expenses are from the Previous Quarter
Using the previous quarter’s Sales and Marketing expenses for the SaaS Magic Number denominator is due to the belief that the majority of Marketing and Sales expenses are incurred in the quarter before the opportunity was closed and the ARR was booked, but not yet recognized as revenue.
The majority of GAAP revenue in an annual subscription business does not show up in the quarter the opportunity was closed.The revenue is recognized ratably over the term of the agreement, which means the majority of revenue is recognized in the quarters after the close date. This is especially true for opportunities over $25K ACV, which tend to close in the last month of a quarter.
As such, using the previous quarters Sales and Marketing expenses as the denominator makes sense due to current quarter Sales and Marketing expenses not really impacting GAAP revenue growth in the current quarter. This is in contrast to most CAC efficiency metrics which measure the efficiency of new bookings (ARR) which have not yet been recognized as revenue on the income statement.
Nuance #4: SaaS Magic Number is NOT Measuring “NEW” ARR Efficiency
Because the SaaS Magic Number is not measuring the investment required to win $X of new ARR and/or $Y of expansion ARR, it is a fairly meaningless metric for Go-to-Market operators to use to identify the specific areas impacting new ARR generation that need to be improved.
It does provide investors a measurement of how efficiently a company is growing GAAP revenue quarter over quarter. For the majority of SaaS companies where “recurring revenue” is more than 90% of total revenue it becomes a good proxy for how efficiently Net New ARR is performing.
However, similar to understanding what percentage of Total GAAP revenue is consumed by Sales and Marketing expenses, the SaaS Magic number is NOT highly correlated to how efficiently a company performs in each of the below primary contributors to a SaaS companies ARR growth:
👉 Customer Acquisition Efficiency
👉 Customer Retention Efficiency
👉 Customer Expansion Efficiency
Nuance #5: SaaS Magic Number Results are Inverted for Planning Purposes
If your SaaS Magic Number is .75, the traditional breakpoint between inefficient and moderately efficient growth, it still presents a major issue for planning purposes which include:
How does the SaaS Magic Number inform an operating executive how much Sales and Marketing investment is required to grow New ARR (New Logo and Expansion ARR) by $10M or achieve 105% NRR?
How does an operating executive use the SaaS Magic Number to know how much budget should be allocated to each of the three primary drivers of ARR Growth?
Generate New Logo ARR
Generate Expansion ARR
Reduce Existing Customer ARR Churn and Down-sells
🔥 SaaS Magic Number does not provide any insight or assistance to answer the above two questions that most SaaS companies and their GTM leaders are currently asking to develop their 2025 Operating Plan!
🙋♂️ The rest of today’s newsletter discussed the metrics that can assist in answering the above questions.
SaaS Magic Number Alternatives for Operators
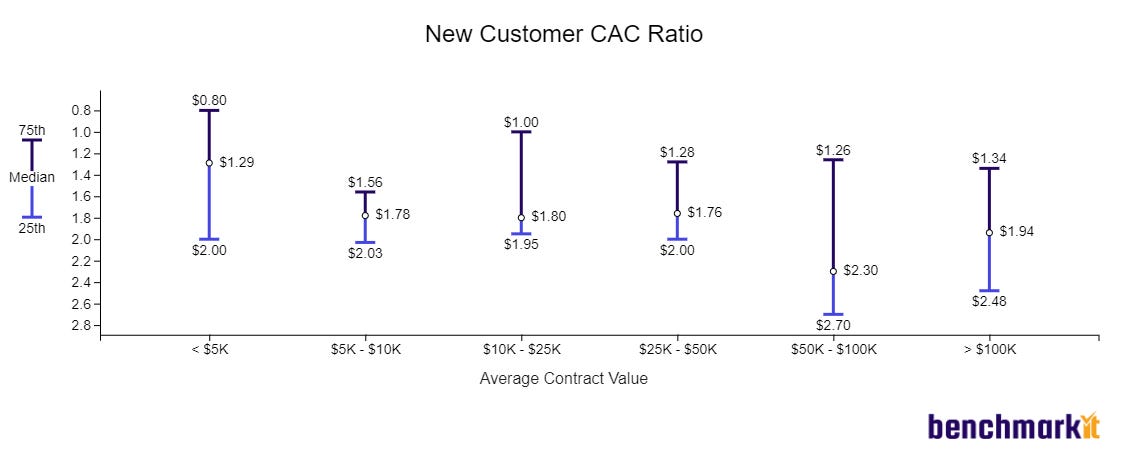
1️⃣ New Customer CAC Ratio
This metric measures how much Sales and Marketing expense was allocated to new customer acquisition to generate $1 New ARR from New Customers in previous periods.
This creates a specific measurement to focus on the efficiency of acquiring new customers and the associated ARR.
The latest benchmarks:
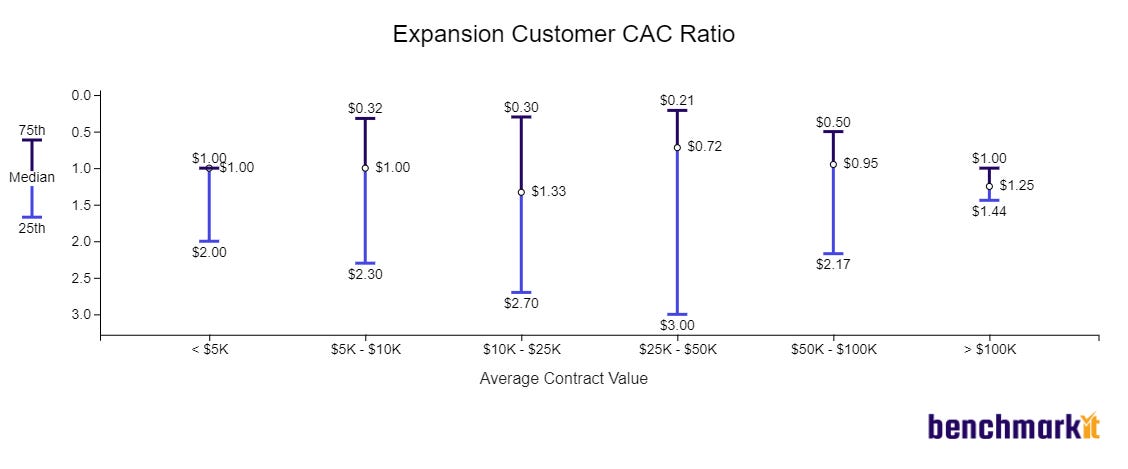
2️⃣ Expansion CAC Ratio
This metric measures how much Sales, Marketing and Customer Success expense was allocated to generate $1 Expansion ARR from Existing Customers in previous periods.
This creates a specific measurement to focus on the efficiency of expanding existing customer ARR
The latest benchmarks:
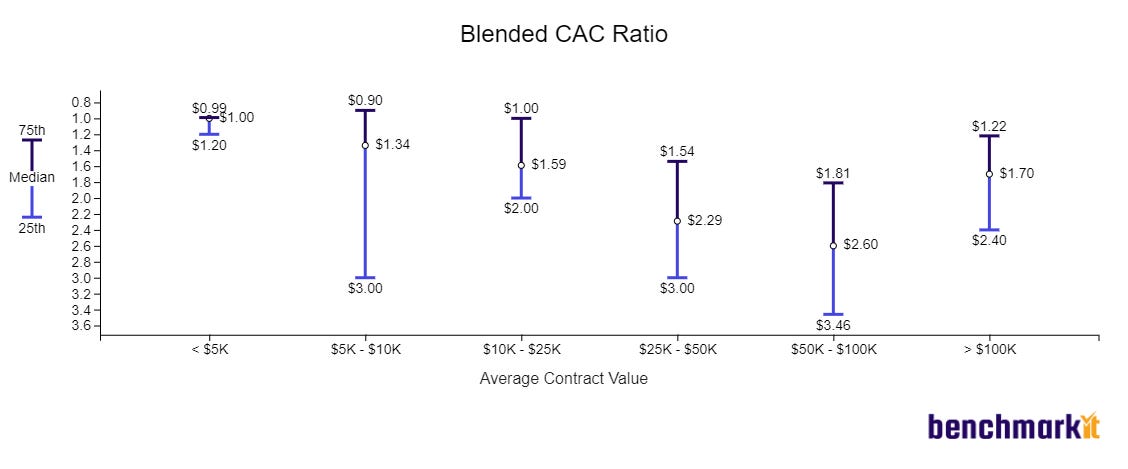
👉 Blended CAC Ratio
This metric measures how much Sales, Marketing and Customer Success expense was allocated to generate $1 ARR from New and Existing Customers in previous periods.
This metric EXCLUDES churn and down-sell which needs to be measured on it's own as the root causes are DIFFERENT than acquiring new ARR
The latest benchmarks:
👉 Customer Retention Cost Ratio
Measures the expenses allocated to customer retention + renewals in previous periods. This expense is determined by determining the percentage of time thus expense of Customer Success Managers, Account Managers and/or Account Executives are being allocated to the retention and renewal of existing customers.
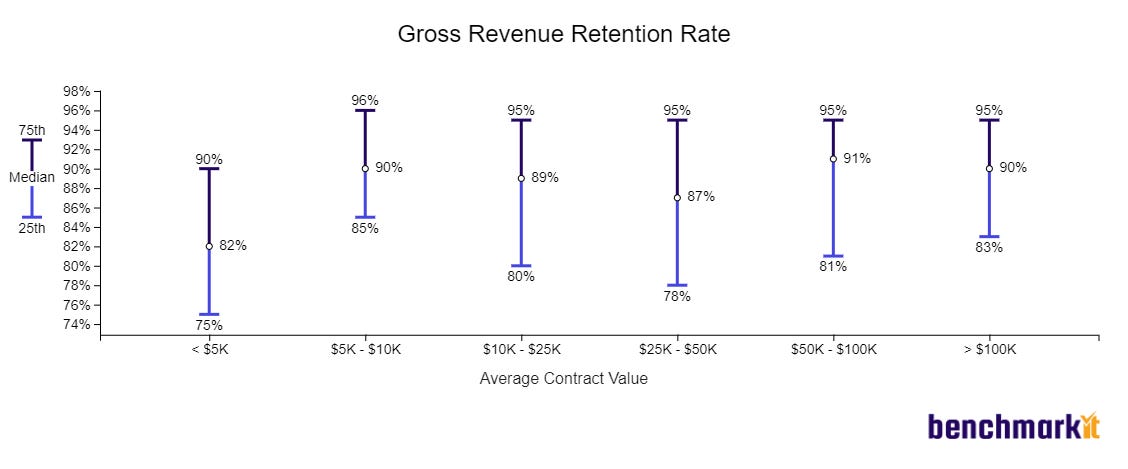
👉 Gross Revenue Retention
A specific measurement to measure the retention of existing customers ARR.
Formula is not as easy to show here as it should be a “cohort” based calculation which takes all customers ARR from a previous period (FY-23) and compare that to the same cohort of customers ARR in the latest period (FY-24) EXCLUDING any expansion ARR from organic expansion, up-sells or cross-sells. It should include all decreases in ARR due to customer churn and/or downsells.
The latest benchmarks:
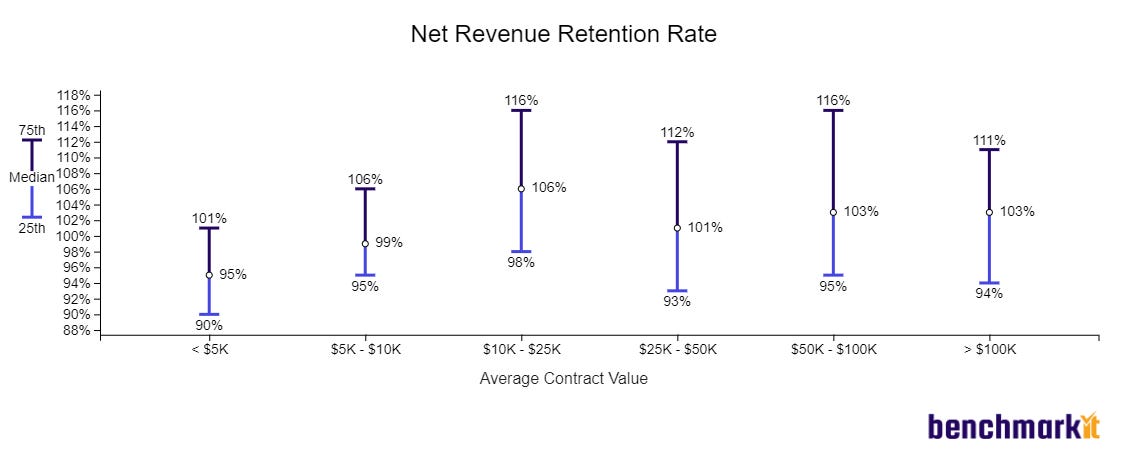
👉 Net Revenue Retention
A specific measurement to measure the retention and expansion of existing customers ARR.
Formula is not as easy to show here as it should be a “cohort” based calculation which takes all customers ARR from a previous period (FY-23) and compare that to the same cohort of customers ARR in the latest period (FY-24) INCLUDING any expansion ARR from organic expansion, up-sells or cross-sells. It should include the period over period decrease in ARR due to customer churn and/or downsells.
The latest benchmarks:
Summary
SaaS Magic Number has been a long-standing go-to metric for SaaS investors and thus the majority of SaaS companies since Rory O’Driscoll first said “It’s Magic” when seeing the efficiency of revenue growth measured against Sales and Marketing expenses all the way back in 2005.
Hopefully for those of you who made it all the way to this last paragraph, you understand why the SaaS Magic number is not that helpful in analyzing what variables are most impacting your company’s growth efficiency. Like all metrics, it is never good to be a slave to any single metric and I would suggest that it’s never a great time to use SaaS Magic Number as a PRIMARY metric to measure and understand what is driving your revenue growth efficiency!
This week’s SaaS Barometer Newsletter is brought to you by SaaS Metrics Palooza 2024. Come join 30 of the SaaS industry’s top leaders as they share the latest in how leading companies are using metrics and benchmarks to inform decisions, achieve efficient revenue growth and maximize enterprise value creation for every stakeholder


