This week’s newsletter is brought to you by Maxio. Maxio is the leading Billing and Financial Operations platform for B2B SaaS companies.
Revenue Growth Efficiency is Heading the Wrong Way!!
“Account Executive Benchmarks Tell Part of the Story”
Growth efficiency was a trending theme throughout all of 2023, beginning right after the “SaaSacre” began in the second half of 2022. In pursuit of efficient revenue growth, Sales and Marketing expenses as a percentage of revenue were reduced by a median of 5% in 2023 in the name of “efficient growth”...but that is not where the story ends.
With all of the talk about revenue growth efficiency, one would expect enhanced Customer Acquisition Cost efficiency metrics such as a reduced CAC Payback Period, lower CAC Ratio and increased sales efficiency.
The reality of how revenue growth efficiency metrics have trended since 2022 is not a pretty story 😢.
Public cloud company CAC Payback Period currently stands at 25.4 months (median) per Meritech Capital. Sales and Marketing Expenses as a percentage of Net New ARR was 205% at median in Q4-23, an increase of 44% from Q1-20 and an increase of 57% since Q4-21!!!
New CAC Ratio which measures Sales and Marketing expenses incurred to generate $1 of new ARR from new logo customers in private SaaS companies continues to increase - hitting $1.85 (median) in 2023, up from $1.76 in 2022 and $1.59 in 2021!!!
What are some of the primary inputs to CAC efficiency metrics? Sales productivity metrics are highly correlated input metrics to CAC efficiency, including Win Rate, Average Annual Contract Value and Account Executive efficiency measured by total compensation as a percentage of revenue.
In order to better understand the key leading indicators to Sales productivity, I went to one of my long-term, favorite Account Executive (AE) benchmarking sources, The Bridge Group’s 2024 SaaS AE Benchmark Report.
Win Rate by ACV Segment
Let’s take a look at how win rates (The Bridge Group) have changed from 2022 to 2024 in SaaS companies. As you can see in the below chart, Win Rates have decreased across the board by an average of four percent, including ~ 4% in the $25K - $100K ACV ranges, which represents the majority of B2B SaaS companies.
1 The Bridge Group 2024 SaaS AE Benchmark Report
One recommendation is to understand how leading indicators, including Win Rate impacts lagging indicators such as CAC Payback Period - specific to new name customer acquisition.
Below are examples of how Revenue Growth Efficiency metrics improve when the Win Rate increases from 20% to 25%.
📈 Win Rate Impact on CAC Efficiency and New ARR Growth
👉 Example #1: CAC Payback Period
Win Rate: Increases from 20% to 25%
ACV: $40,000
S&M Expenses: $1,000,000
Total Deals Won at 20% Win Rate: 20
Total Deals Won at 25% Win Rate: 25
Gross Margin: 75%
20% Win Rate: (($1,000,000)/($40,000 x 20 x.75)) = 20 Month CAC Payback
25% Win Rate: (($1,000,000/($40,000 x 25 x .75)) = 16 Month CAC Payback
Anyone who has followed me or my metrics brother Dave Kellogg, knows that the CAC Ratio is one of our favorite SaaS revenue growth efficiency metrics.
Let’s take a look at the impact on New CAC Ratio using the same example of increasing win rates to 25% from 20%.
👉 Example #2: New CAC Ratio Example
Win Rate: Increases from 20% to 25%
ACV: $40,000
S&M Expenses: $1,000,000
Total Deals Won at 20% Win Rate: 20
Total Deals Won at 25% Win Rate: 25
Gross Margin: 75%
20% Win Rate: (($1,000,000)/($40,000 x 20)) = $1.25 New CAC Ratio
25% Win Rate: (($1,000,000/($40,000 x 25)) = $1.00 New CAC Ratio
Often sales professionals prefer to look at the ultimate outcome metric in SaaS sales - New ARR won. Let’s look at the impact on New ARR with the same increase in Win Rate.
👉 Example #3: New ARR
Win Rate: Increases from 20% to 25%
ACV: $40,000
S&M Expenses: $1,000,000
Total Deals Won at 20% Win Rate: 20
Total Deals Won at 25% Win Rate: 25
Gross Margin: 75%
20% Win Rate: 20 New Deals Won x $40,000 ACV = $800,000 New ARR
25% Win Rate:25 New Deals Won x $40,000 ACV = $1,000,000 New ARR
🔎 Other SaaS performance metrics impacted by Win Rate include SaaS Magic Number, S&M as % of Revenue, and CLTV:CAC Ratio
💡 Metrics and Benchmarks only tell you where you are - but HOW to increase win rates is most important - some ideas below:
- Increase Marketing and Sales focus on the top ICP as measured by win rate, GRR, and NRR
- Enhance rigor on MQL → SQL → SQO (Stage 2) → Closed-Won conversion rates
- Introducing Stage-based gates and measuring stage-by-stage conversion rates goes a long way...
- Analyze and identify the variables of Stage 2 opportunities that have the highest conversion rate to Closed-Won, double down on the top performing ICPs and enhance SQO (Stage 2) criteria accordingly
- Revenue Intelligence software that automates deal inspection is a good additional
🦉 Understanding WHEN in the sales process produces the highest win rates is a critical insight to understanding and then developing deal strategies that lead to better forecasts. Win rates are a point-in-time measurement that changes over time. As an example, win rates will be different in the first 60-90 days of a sales cycle versus in days 91 - 150 of a sales cycle. Understanding the different win rates using historical data is a great predictor for future win rates and better forecasts.
📊 Account Executive Compensation Trends (‘22 - ‘’24)
Sales expenses are typically twice the Marketing expenses in B2B SaaS companies with ACV ranges in the $25K - $100K range. Thus, impacting Sales Productivity will materially increase revenue growth efficiency metrics…BUT how have Sales Productivity metrics trended since the great SaaS correction started in 2022?
👉 Quota:OTE (On-Target Earnings) Ratio used as the industry standard for years was 5x. Effectively this says an AE’s OTE is 20% of quota. Example is a $1,000,000 quota is appropriate for an Account Executive with a $200,000 OTE.
📅 The Quota:OTE Ratio has decreased to 4.2x at median
- 25th Percentile = 3.2x Quota to OTE Ratio
- 75th Percentile = 4.8x Quota to OTE Ratio
1 The Bridge Group 2024 SaaS AE Benchmark Report
This translates to OTE being 23.8% of quota.
🤔How did the Quota:OTE Ratio decrease by 16% at the same time the SaaS AE On-Target Earnings increased from 20% to 23.8% in an era of "growth efficiency". I thought reviewing commission rates would be a good place to start the analysis.
👉 Industry standard for effective commission rate at quota has been ~ 10% for years (‘15 - ‘22)
📈 Majority of VC plans have a sliding scale of commission rates that resulted in the ~ 10% effective commission rate at 100% achievement. For example at $1,000,000 Quota available commission to be paid is $100,000.
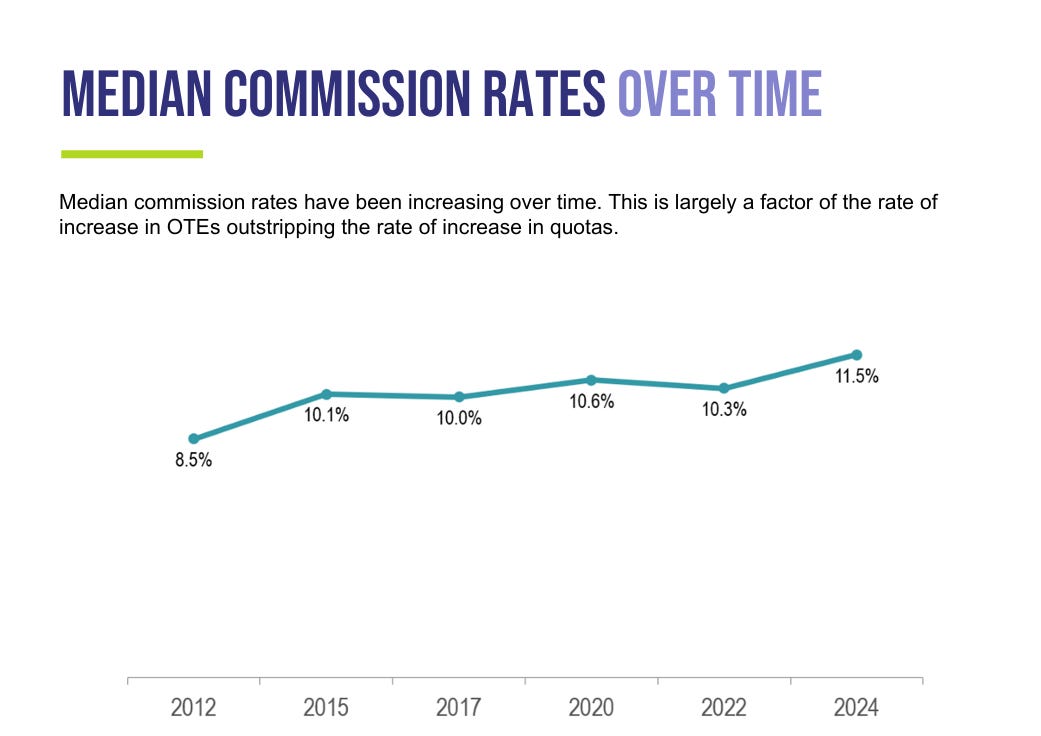
📅 In 2024 the median commission rate at 100% quota achievement is 11.5% (The Bridge Group). Using the same example of a $1,000,000 quota this would result in a total commission of $115,000 versus $103,000 just two years earlier - quick math says that is ~ 14.7% greater than in 2022!!
1 The Bridge Group 2024 SaaS AE Benchmark Report
🤔 How did the commission rate increase by 1.5%? Using an alternative calculation, the commission rate increase could be viewed as a 15% increase ((11.5%/10.3%) - 100%)) = 14.7%
If commission rates have increased during a period of “growth efficiency” - I had to ask the question how have On-Target Earnings (OTE) changed since the beginning of 2022? The answer I found resulted in 😱
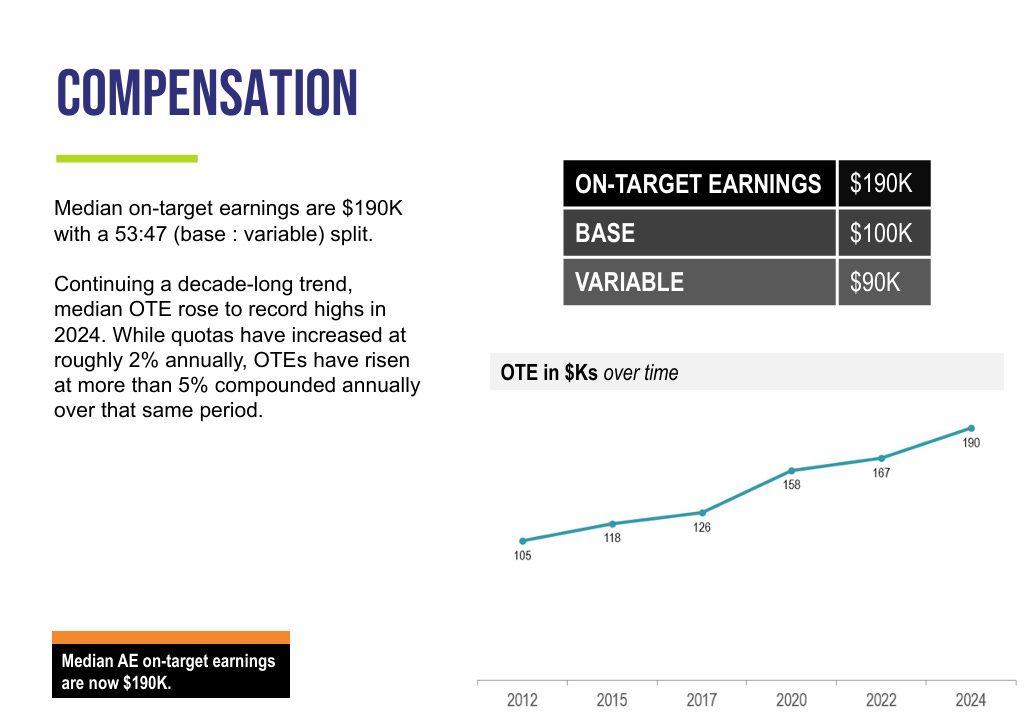
👉Since 2022 OTE (Median) has increased from $167K to $190K (14%)
1 The Bridge Group 2024 SaaS AE Benchmark Report
I reflected on inflation rates and the macroeconomic reality during the post-ZIRP period to try and justify the increases - but thought that quota increases would have reflected a similar increase to try and maintain existing CAC efficiency metrics.
From the data below, my assumption that companies used increased quota to offset the increased OTE and commission rates was not accurate…a key reason why benchmarks are important to review whenever possible before making decisions on critical company guiding objectives defined and measured by metrics!
🔎 Quotas have increased by 8% ($740K to $800K at median) since the start of 2022
🤯 Quota achievement has decreased by 15% at the same time - this effectively increases the base salary percentage of new ARR produced by every AE!
1 The Bridge Group 2024 SaaS AE Benchmark Report
👆 At the same time of increasing OTE and commission rates, CAC Payback Periods have increased, New CAC Ratio has increased, and S&M Expenses as a percentage of revenue have increased all while the percentage of AEs achieving quota has dipped to ~ 51% (some research says as low as ~40).
💯 Maybe increasing OTE (%) and commission rates (%) more than quota (%), coupled with fewer people hitting quota has something to do with the DECREASED CAC Efficiency we are experiencing???
⏰🔔 Alarm bells should be going off regarding the need for different approaches to new customer acquisition and re-engineered Sales Compensation plans in pursuit of "more efficient revenue growth
🗣 With the continued buzz on increasing revenue growth efficiency, and how an integrated Go-to-Market (GTM) strategy is critical to more efficient growth I am looking forward to the 2024 benchmarks…but before then let’s evaluate how to move Sales Compensation & Sales Productivity & CAC Performance metrics in directional alignment!!!
If you are enjoying the SaaS Barometer Newsletter click here to join the Benchmarkit insider audience to receive early and preferred access to new benchmarking research, content, podcasts and events.
Benchmarkit in partnership with the SaaS CFO is conducting a
series of executive dinners to enable our community
to learn, share best practices, and engage with their industry peers.
Click here to register for a dinner in Denver, New York, Chicago or San Francisco


You really have to wonder how much of that quota attainment over time plummet is attributed to VPs throwing head count at the problem of generating revenue?