

Forecasting ARR and MRR
The Framework SaaS Leaders Actually Need

Every finance leader right now is wondering: "What does AI mean for my team?"
Forward-thinking CFOs are already using AI to speed up modelling, surface insights that humans might miss, and free up time for strategic work.
This week’s sponsor, Drivetrain AI, is redefining planning and analysis. Drivetrain’s autonomous agents can build models in minutes, transform data in seconds, detect anomalies instantly, and so much more.
This week’s SaaS Barometer Newsletter was written by Josh Arharonoff, Founder and CEO ModelWiz - also known as Your CFO Guy! For excel templates, courses and to subscribe to Josh’s Newsletter click here.
Companies will spend weeks building these elaborate models...only to base their projections on gut feelings and wishful thinking.
Then Q3 rolls around and ARR comes in 15% below projections. Suddenly everyone's scrambling to figure out why the model didn't account for that summer churn spike that happens EVERY SINGLE YEAR.
I've worked with dozens of SaaS companies through my accounting firm, Mighty Digits over the years, while building some amazing financial models through our excel add in, Model Wiz. Here's what I've learned: the companies that nail their forecasts aren't trying to predict the future. They're just really good at understanding their own patterns.
Think about that difference. One group is guessing. The other is applying what they already know about their business to make educated projections.
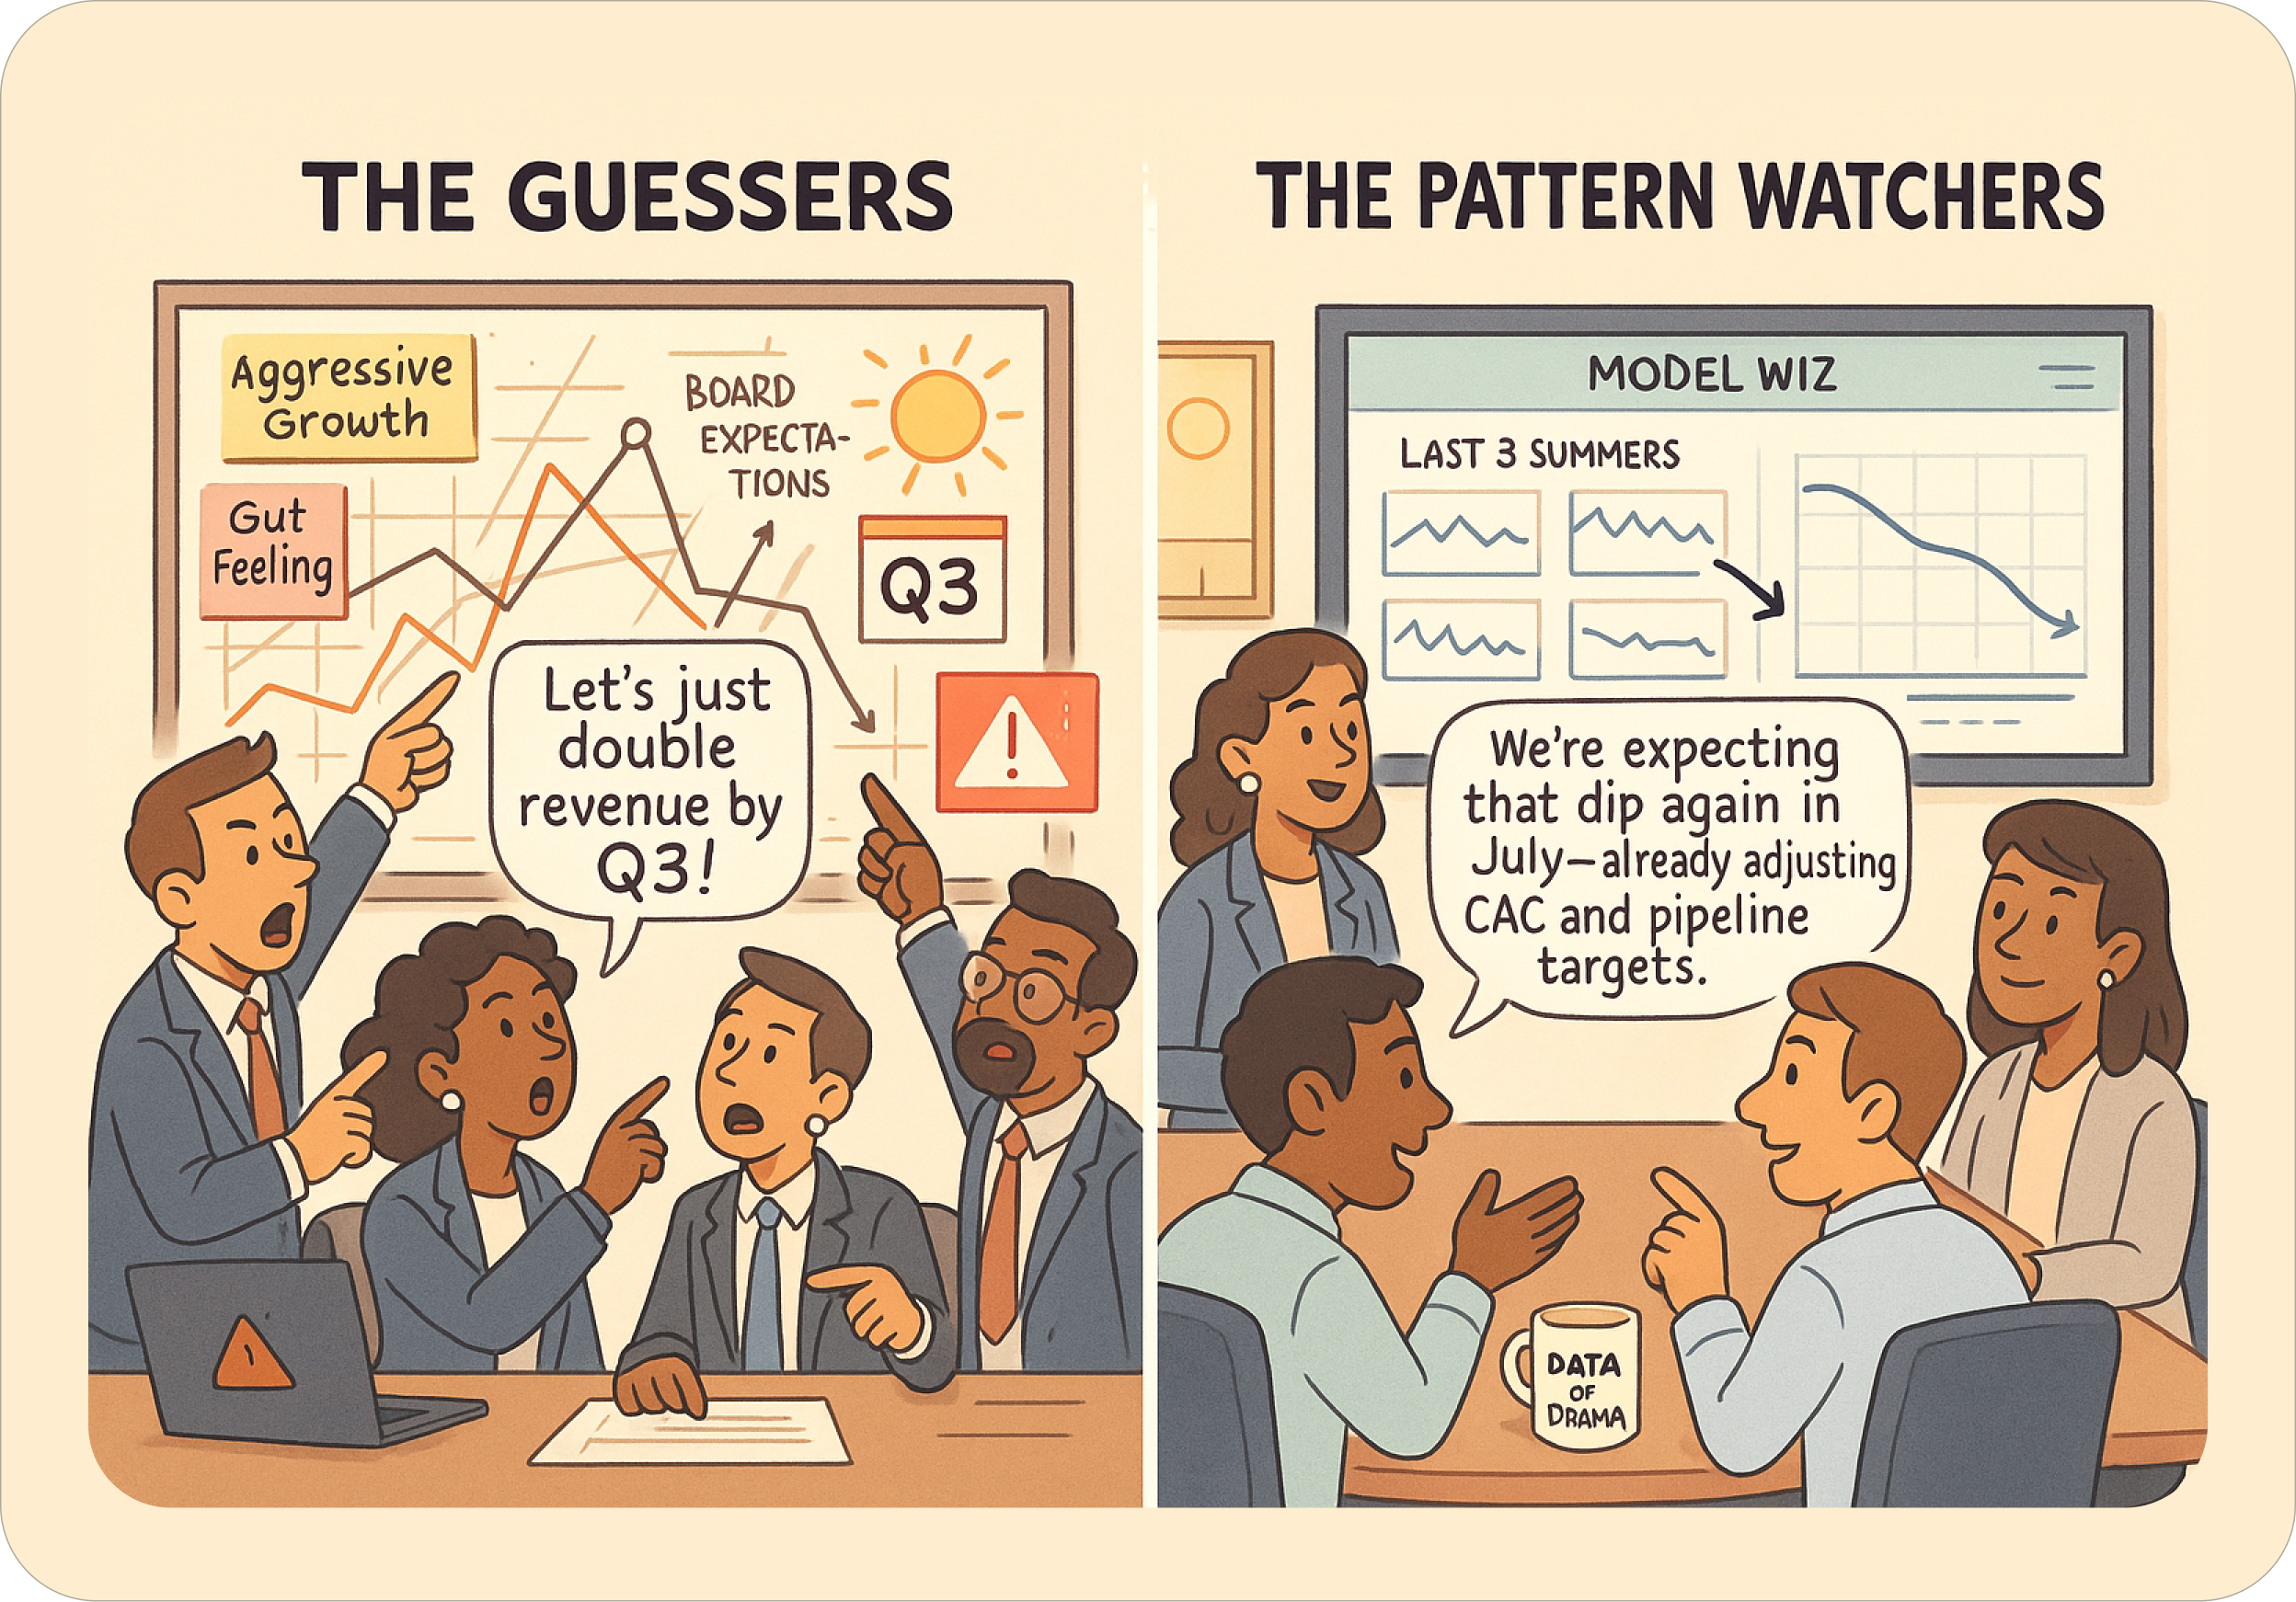
The secret? Build your forecasts on historical movement patterns, not on whatever number makes the board happy.
Setting Up Your ARR and MRR Structure
The first thing you need is historical data. This usually comes from your SaaS metrics tool like Maxio or Stripe, but it could just be an Excel file you've been tracking manually.
The key is having this information organized so you can create a mechanism to refresh it and add new months as they happen.
Here's how to structure your ARR and MRR sections:

Opening - This is always equal to the last month's ending balance New - New customer additions
Churn - Lost customers Expansion - Existing customer upgrades Contraction - Existing customer downgrades
Ending - Sum of all the components above
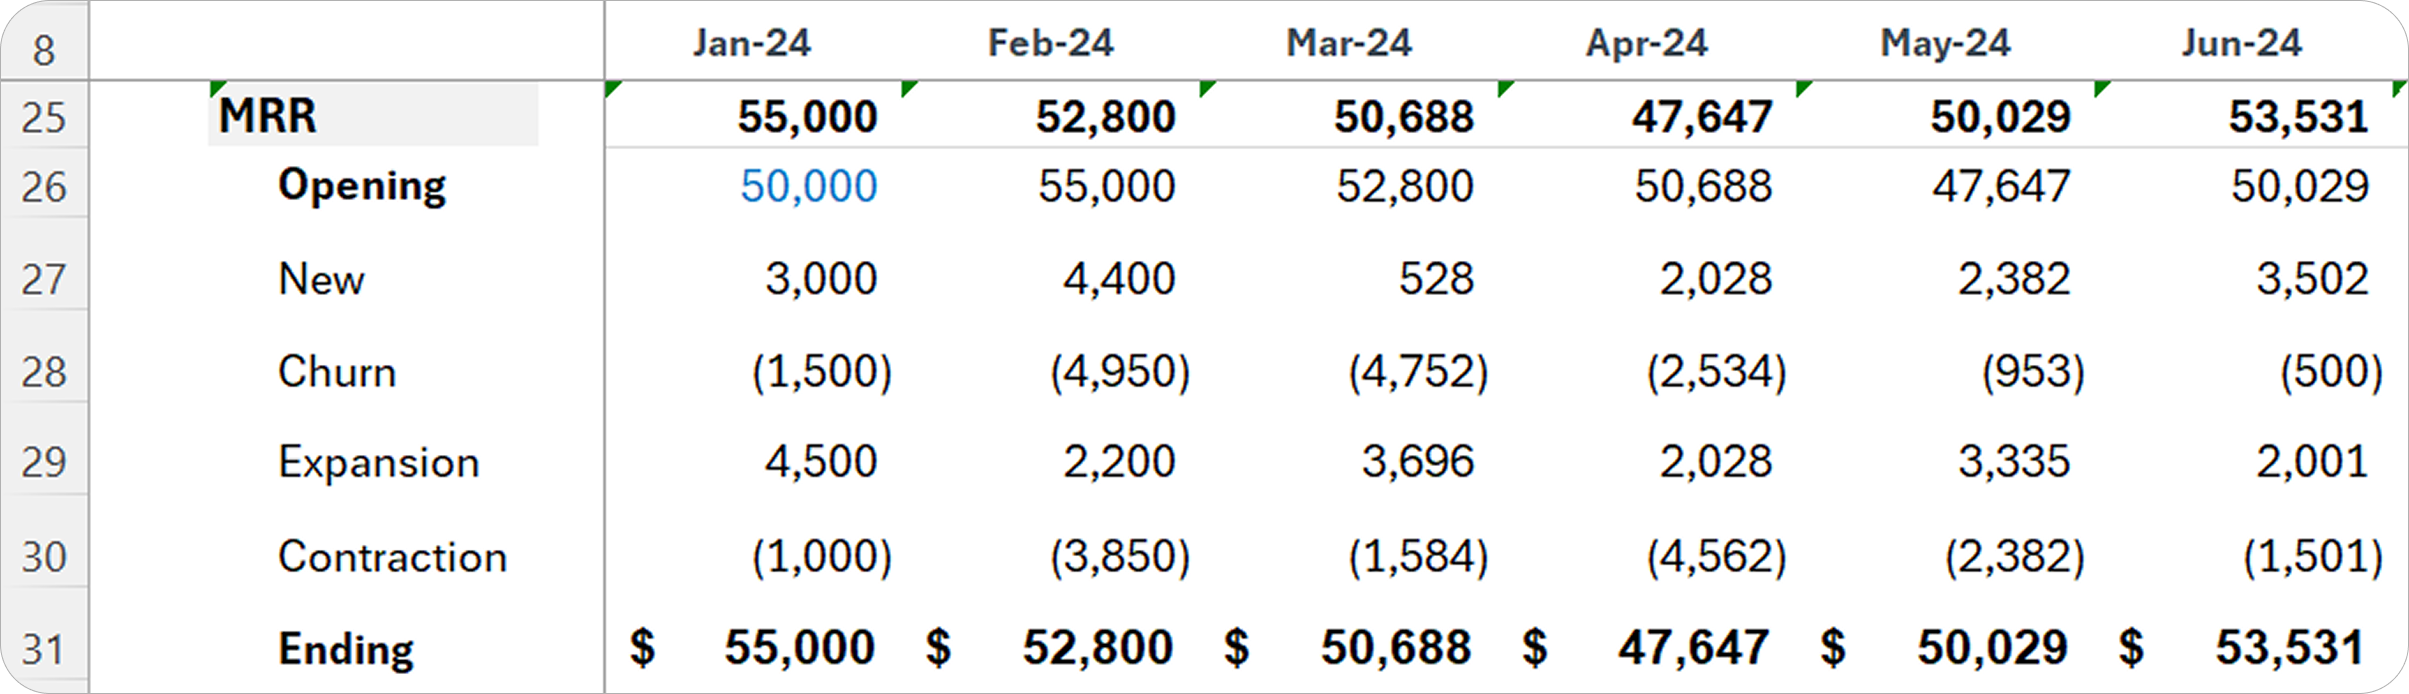
Your MRR is simply your ARR divided by 12. Wrap it in an IFERROR function in case there's a zero.

The magic happens when you separate historical values from projections. For historical months, you pull directly from your ARR import data. For future months, you calculate based on patterns.
Calculating Movement Percentages
You know what most people get wrong? They try to forecast absolute numbers instead of percentages.
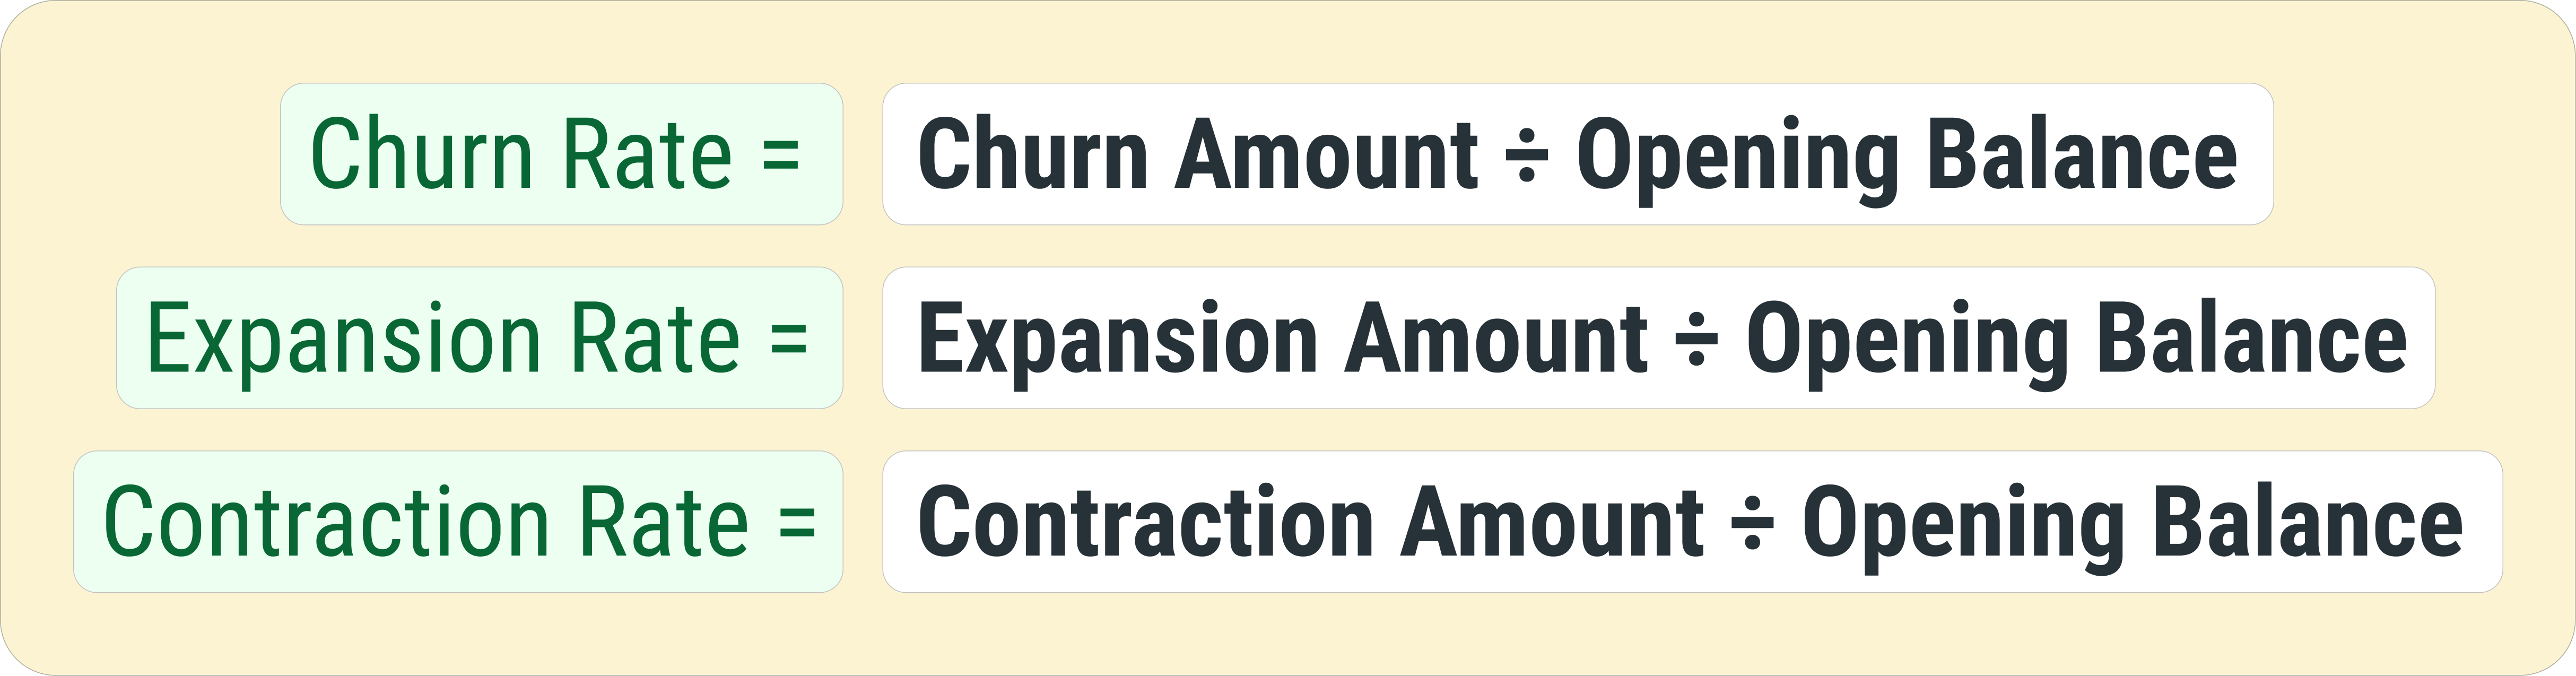
The companies that nail their forecasts calculate churn, expansion, and contraction as percentages of their opening balance. Then they apply those percentages to future projections.
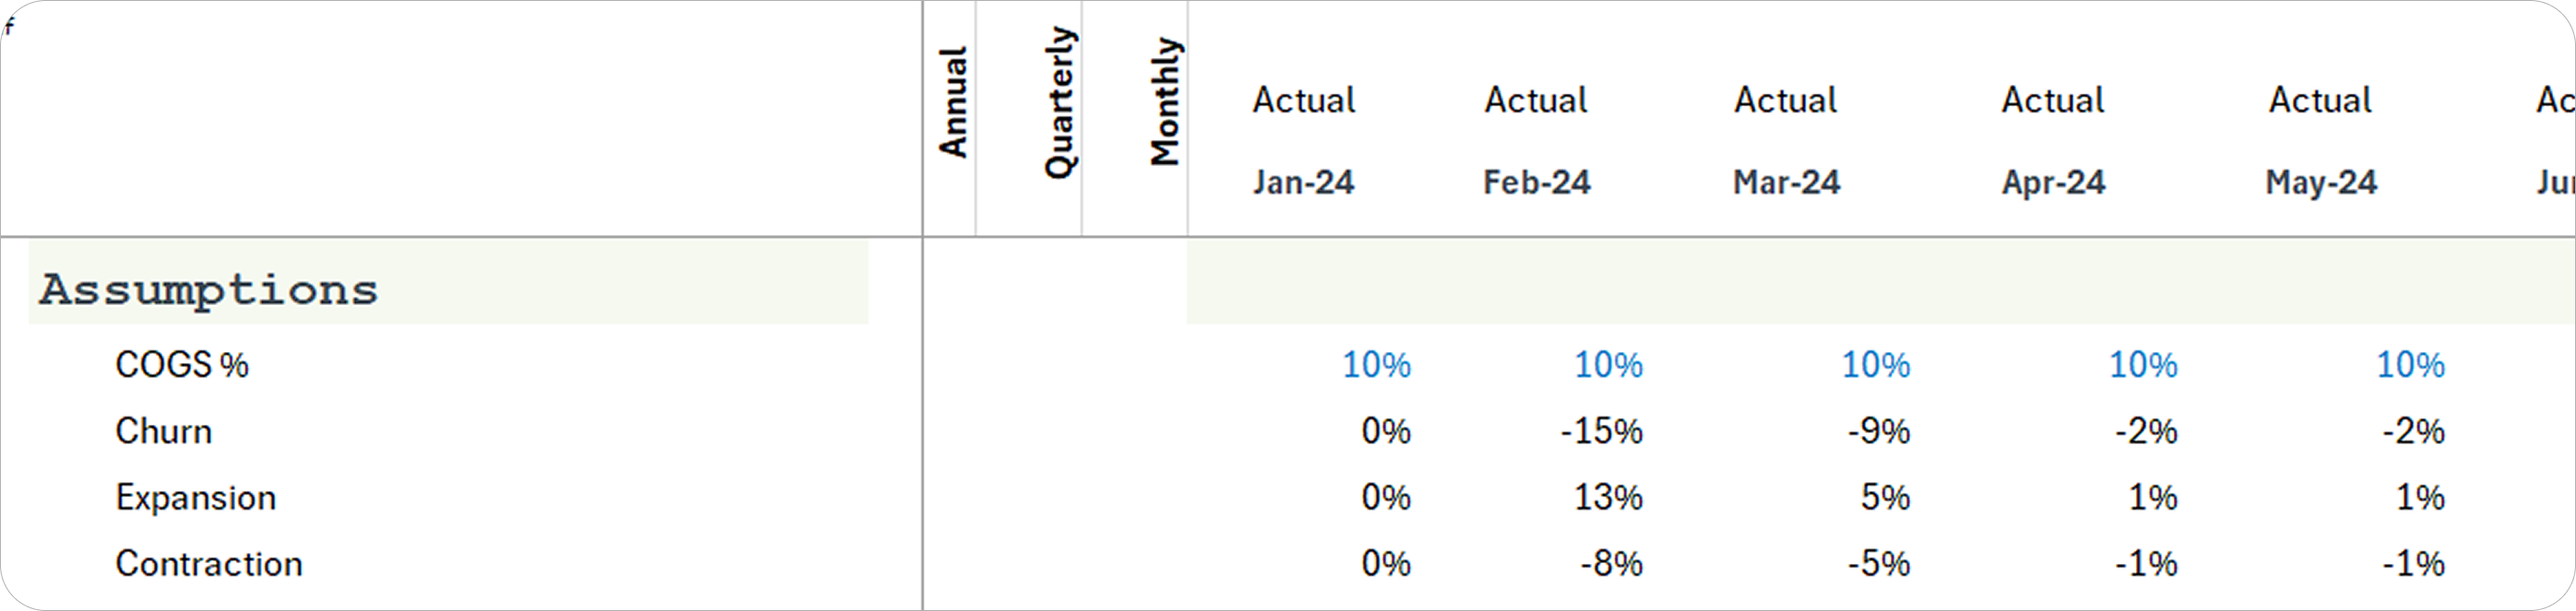
Here's the formula: take your churn amount and divide it by the opening balance for that month. Same for expansion and contraction.
But here's the key part...you want this to be dynamic. Set up a formula that says: if this month is less than or equal to your latest month of actuals, run the percentage calculation. Otherwise, take an average of the last six months.
This way, your historical months show actual performance, but your projection months automatically use a rolling six-month average.
Want to override the averages? Just change the percentage manually, and your projections update automatically.
Bringing in New Customer Data
New ARR comes from two places: your new customer tab and your pipeline tab. You don't pull from existing customers because that's not new ARR...that's just existing customer changes.
For pipeline, you need to convert everything to annual values:
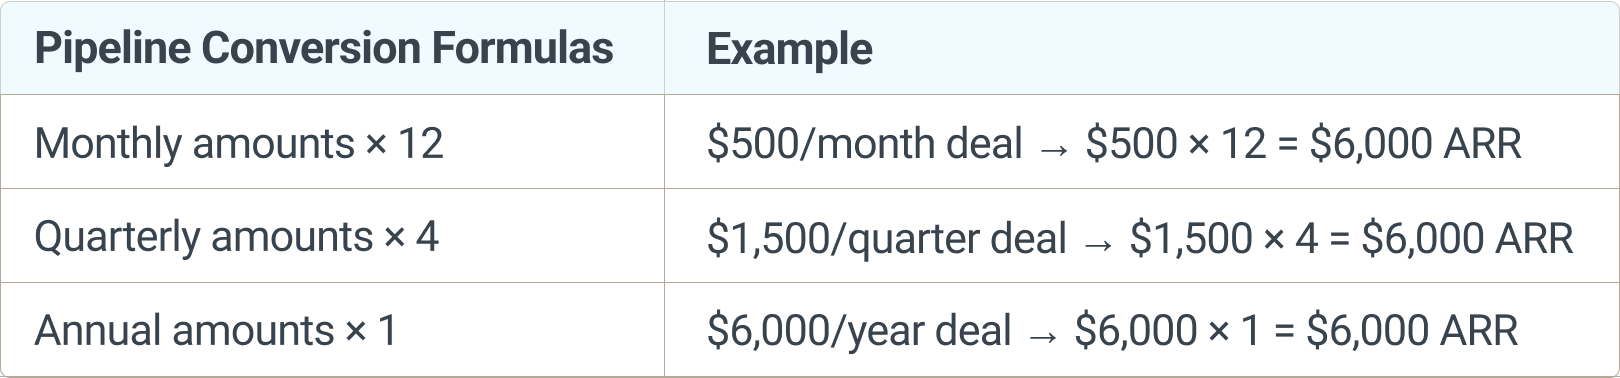
Again, use the same logic...if you're in a historical month, pull from your ARR import. If you're in a projection month, pull from your new customer and pipeline projections.
How to Forecast Churn, Expansion, and Contraction
Now that you have percentages for your churn, expansion, and contraction for all historical months, projecting this information is really easy. Simply take your opening balance and multiply it by your projected percentages that we calculated above using an average of the historical percentages.
For example, if churn as a percentage of your opening ARR for the last three months was an average of 3%, you now have your projected churn for this month. Take your opening ARR, multiply it by -3%, and now you have a churn projection that is defensible. Repeat these same steps for your expansion and contraction, and if needed, tweak your numbers based on how you see the business progressing.
The Revenue Impact
Once you have your net additions to ARR (which is the sum of churn + expansion + contraction), you need to show the revenue impact.
Add a "Net Additions to ARR" row to your billings section. For historical months, this should be zero. For projection months, sum up your churn, expansion, and contraction.
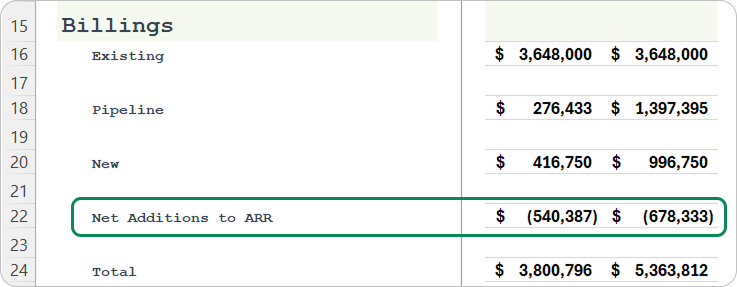
For projection months, since ARR is an annual value, simply divide that amount by 12 using a revenue waterfall as such.
Why This Actually Matters
Companies that implement this approach see immediate improvements in forecast accuracy, but you know what the REAL value is? The insights you gain about your business.
When you break ARR down by its components, you start seeing patterns you missed before. You'll notice that enterprise customers expand differently than SMB customers. You'll see that churn patterns vary by acquisition channel. You'll understand how seasonal trends affect different parts of your business.
This isn't just better forecasting...it's better business intelligence.
Your board meetings become more strategic because you're discussing the drivers of growth, not just the results. Your sales team gets better at pipeline management because they understand how their deals flow through to ARR. Your customer success team can proactively address churn patterns before they become problems.
Most importantly, you'll stop being surprised by your own numbers.
The next time someone asks for an ARR forecast, you won't be guessing. You'll be applying proven patterns from your own business to make projections you can actually defend.
Think about that difference. One approach leaves you scrambling to explain misses. The other puts you in control of your growth story.
This whole challenge of building reliable forecasting models that don't break every month is exactly why I created Model Wiz. Too many finance teams spend their time rebuilding templates instead of analyzing insights. The goal should always be spending more time understanding your business patterns and less time fighting with spreadsheets.
What's your experience been with ARR forecasting? Are you seeing the patterns in your business that I'm talking about here?
SaaS Metrics Palooza ‘25 is ready for its fourth year - going live on October 8th. If you use metrics, calculate metrics, report metrics or are responsible for SaaS metrics performance in your B2B SaaS company this is a can’t miss event with 2,000+ of your industry peers in a virtual format, with every session available on-demand to fit your calendar!
Click here to check out the A-List speakers, the trending topics to be discussed and to secure your free pass!!!