In the previous edition of the SaaS Barometer Newsletter we covered the latest B2B SaaS Account Executive Benchmarks. We added our commentary on how those Sales Compensation and Performance metrics impact some of the most important Customer Acquisition Cost efficiency metrics, such as the CAC Payback Period and CAC Ratio.
This week, we provide a “sneak peak” into the latest Customer Acquisition Cost efficiency benchmarks Benchmarkit gathered during our 2024 benchmarking research which just closed on April 30th and also from recent public SaaS and Cloud company benchmarks.
CAC Payback Period (CPP):
Customer Acquisition Cost Payback Period is a common revenue growth efficiency metric, and one of the most misunderstood and miscalculated SaaS metrics. The SaaS Metrics Standards Board calculation formula is:
Fully Loaded Sales and Marketing Expenses
------------------------------------------------------------------------------ x 12
Contracted ARR from New Customers x Subscription Gross Margin
The CAC Payback Period calculation formula most commonly used for public companies, and the one specifically used by Jamin Ball, Clouded Judgment is:
Previous Quarter Sales and Marketing Expenses
---------------------------------------------------------- x 12
Net New ARR x Subscription Gross Margin
The differences in the two formulas include: 1) Public company calculation uses Net New ARR versus New CARR in the denominator; 2) The Clouded Judgment calculation uses previous quarter Sales and Marketing expenses versus current quarter.
Public SaaS CAC Payback Period (Jan, 21 - May, 24):
Source:Clouded Judgment - Jamin Ball
The increase in CAC Payback Period for public SaaS and Cloud companies is being driven by a decrease in top line revenue growth rates, including a decrease in Net Revenue Retention (NRR) Rates from a median of 120% in 2022 to a median of ~ 110% in 2023. The decreasing NRR is due to a combination of increasing churn and decreasing customer expansion revenue due to less up-sells, cross-sells and reduced product utilization in Usage-Based pricing products.
In the most recent Benchmarkit private SaaS company benchmarking research, one potential approach to increase growth efficiency presented itself with Product-Led Growth (PLG) companies. A Product-Led Growth motion includes a self-service approach where new users are able to sign-up and start using a product without the need for a Sales person to demonstrate the product, nor the need for Customer Success Manager to on-board the new customer.
Additionally the most recent Benchmarkit private SaaS company benchmarking research highlighted that a Usage-Based Pricing model coupled with an underlying subscription for platform access may be a good path to increase customer acquisition cost efficiency. The chart below on the right, highlights that in a “hybrid pricing model” the CAC Payback Period decreased across the entire population (~ 1,000 companies) from 17 months in a pure Usage-Based pricing model and 14 months in a pure Subscription based pricing model to 12 months in a Hybrid pricing model.
The charts below show the latest benchmarks for a Product-Led Growth versus Sales-Led Growth customer acquisition motion and also for a Subscription based pricing model versus a Usage-Based pricing model:
Go-to-Market Motion Segmentation
Source: Benchmarkit 2024 SaaS Metrics Benchmarks
Blended CAC Ratio:
Blended CAC Ratio measures how much Sales and Marketing expense on a fully loaded basis is required to generate one dollar of New ARR from the combination of both new customers and existing customer expansion. The SaaS Metrics Standards Board calculation formula is:
Fully Loaded Sales and Marketing Expenses
----------------------------------------------------------------------------------
Contracted ARR from New Customers + Existing Customer Expansion
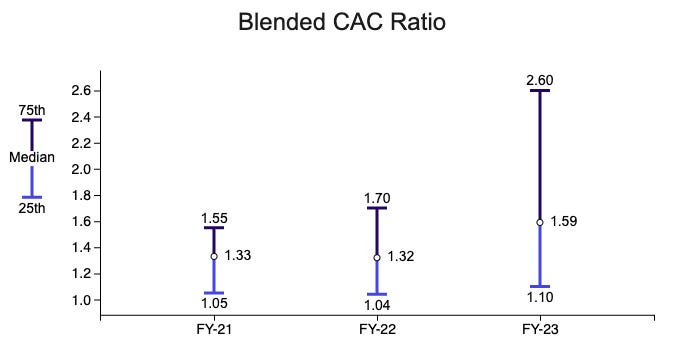
A lower Blended CAC Ratio highlights more efficiency in adding ARR. Per the chart below, the Blended CAC Ratio has increased to a median of $1.59 in Sales and Marketing expenses to generate $1 in New ARR.
This increase in the Blended CAC Ratio is consistent with the increasing CAC Payback Period in public SaaS and Cloud companies EVEN THOUGH Sales and Marketing expenses have been reduced by 5% - 10% in most companies.
Below is the benchmark chart for Blended CAC Ratio from the Benchmarkit 2024 research including the trends from 2021 through 2023:
Source: Benchmarkit 2024 SaaS Metrics Benchmarks
The above increase is reflective of the current reality that the decrease in new customer ARR in combination with existing customer expansion ARR is not enough to off-set the reduced Sales and Marketing expenses in 2023.
The above trends in the cost to acquire a dollar of ARR from new customers, in combination with the continued new customer acquisition challenges in Q1-24 highlights that we are not returning quickly or maybe ever to materially highest higher growth rates for the majority of SaaS companies. The data suggests the need for a material change in the customer acquisition strategies and tactics that served the SaaS industry well in the 2012 - 2021 timeframe.
New CAC Ratio:
The New CAC Ratio measures how much Sales and Marketing expense on a fully loaded basis is required to generate one dollar of New ARR from new logo customers. The SaaS Metrics Standards Board calculation formula is:
Fully Loaded Sales and Marketing Expenses
------------------------------------------------------
Contracted ARR from New Customers
A lower New CAC Ratio highlights more efficiency in acquiring ARR from new customers. Per the chart below, the New CAC Ratio has increased to a median of $1.85 in Sales and Marketing expenses to generate $1 in New Customer ARR.
Source: Benchmarkit 2024 SaaS Metrics Benchmarks
The above increase in New CAC Ratio further amplifies that a decrease in Sales and Marketing investment alone is not resulting in improving efficient revenue growth.
New strategies, tactics and approaches to acquiring new customers is an imperative for long term, sustainable and efficient growth across the industry.
Sales and Marketing Expenses (Percent of Revenue):
Sales and Marketing expenses measured against annual revenue is a traditional measure. In high growth companies and during high growth industry cycles, a higher percentage of Sales and Marketing expenses was an acceptable trade-off in the pursuit of higher growth rates. During the past six quarters, growth rates have been cut in half for both private and public SaaS companies, resulting in the need for drastic expense reductions.
Below is the chart that shows the 25th percentile, median and 75th percentile Sales and Marketing expense to revenue calculations segmented by revenue in private SaaS companies:
Source: Benchmarkit 2024 SaaS Metrics Benchmarks
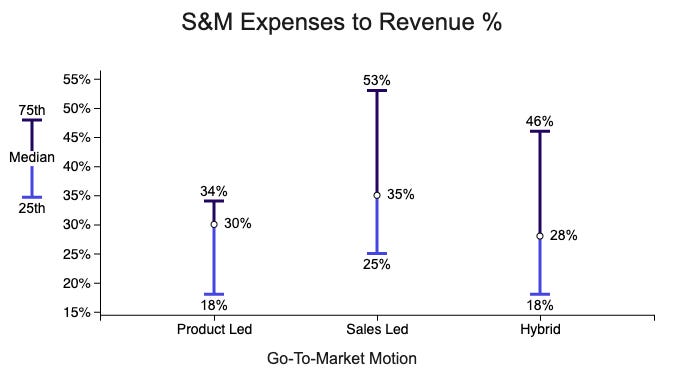
Below is a chart that shows the difference in Product-Led Growth versus Sales-Led Growth versus Hybrid-Led growth models in the Sales and Marketing Expense to revenue measurement:
Source: Benchmarkit 2024 SaaS Metrics Benchmarks
Using the above benchmarks, it would be pretty easy to jump to the conclusion that a Product-Led growth or a hybrid strategy that combines both Product-Led and Sales-Led motions would be a more efficient approach to growth than a Sales-Led motion.
There are multiple considerations to analyze before jumping into a Product-Led Growth motion. Required investments include product enhancements making it possible for new users to on-board, configure and use in a self-service environment. In addition, Marketing programs that increase awareness to end users (versus companies) that may include more targeted paid search, social media targeting, relevant on-line community engagement and built-in user referral capabilities.
One of realities in PLG companies is that once a critical mass of individual users and/or group of users begin using a product, the larger opportunity as measured by Contracted ARR and increased NRR resides in converting initial users into “enterprise customers’ on a contract with minimums.
This conversion to a company-wide agreement requires the additional resources responsible for converting users and groups of users into corporate accounts. This conversion is typically accomplished by adding a “growth marketing team” and “account managers or account executives”. Often in the $50M - $100M range, PLG companies begin to spend MORE in Sales and Marketing as a percentage of revenue than traditional Sales-Led companies. Below is a chart that highlights the above mentioned reality to consider in public SaaS and Cloud companies with a PLG motion:
Source: David Spitz - Benchsights
The above chart highlights that Product-Led growth in isolation may seem like a more efficient customer acquisition and even customer expansion motion. When analyzed in greater detail and over a longer time horizon - the PLG grass may not be greener or more efficient during a meaningful scale phase ($50M - $500M ARR)....plan accordingly.
Sales and Marketing Expenses (Percent of Net New ARR):
Though Sales and Marketing as a percentage of revenue is a traditional measure of how investments in S&M correlate to revenue, it does not provide a good view on how that investment in Sales and Marketing translates to revenue growth. As such, and especially in the Saas and Cloud industry that has historically been a story about growth versus profitability, taking a look at the S&M expenses measured against ARR growth provides instructive insights.
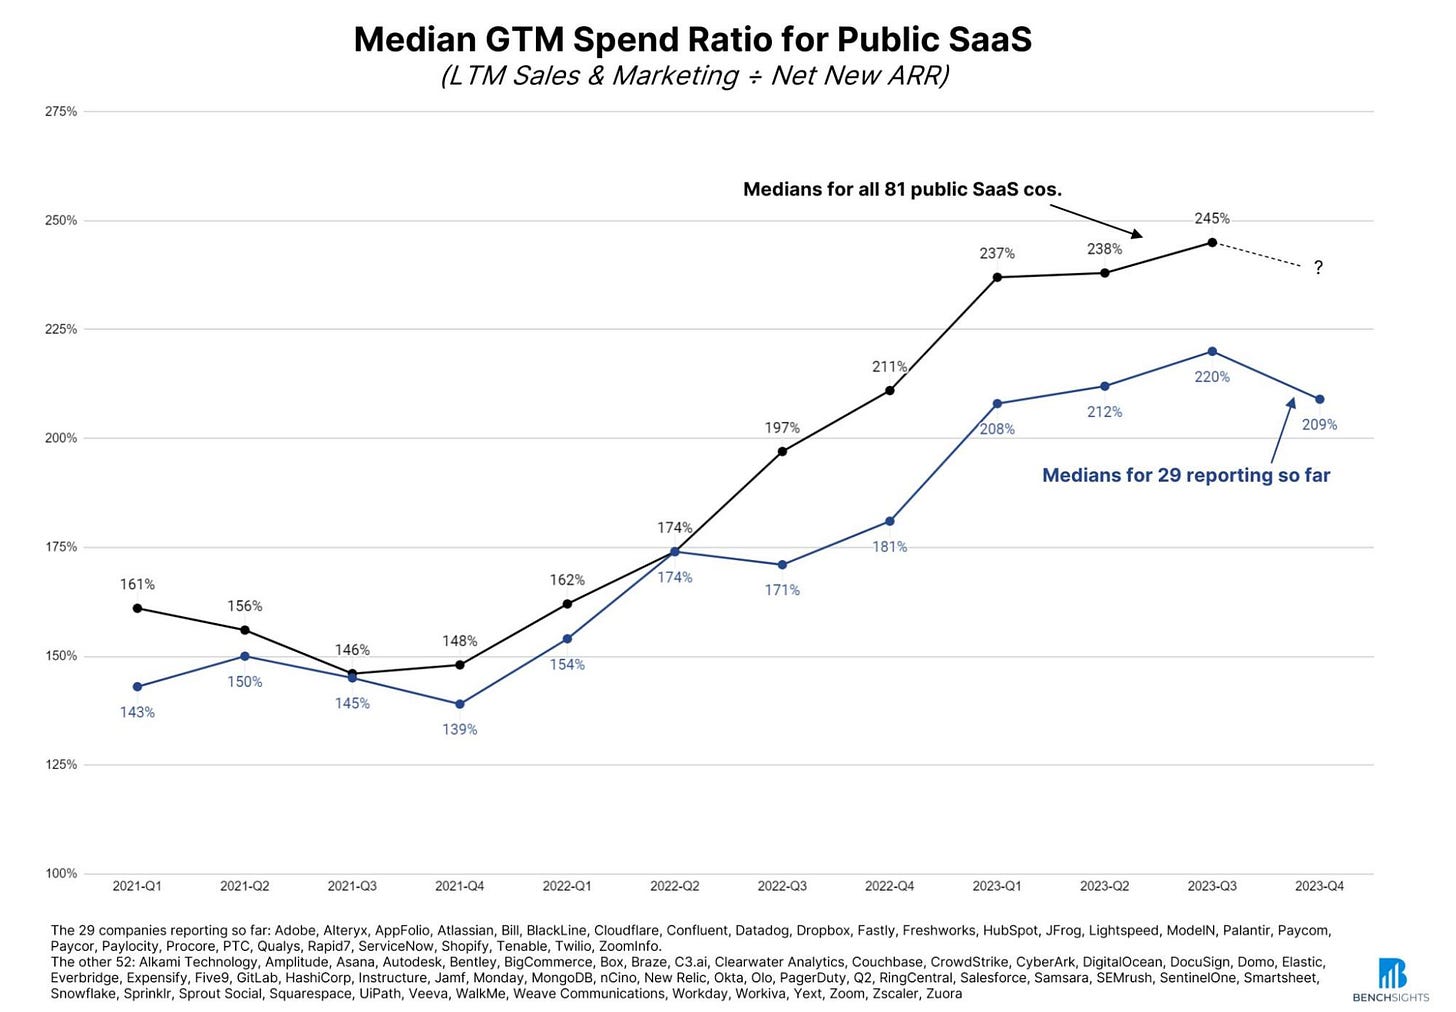
Specially in the below chart, the view is how the last twelve months of Sales and Marketing investments compare to Net New ARR growth. Net New ARR includes the impact of four primary input variables including: 1) New Customer ARR; 2) Existing Customer Expansion ARR; 3) Existing Customer Churned ARR and; 4) Existing Customer Decreased ARR from Down-sells or reduced usage.
Source: David Spitz - Benchsights
The above chart includes the trends for this measurement from Q1-21 through Q4-23. The stark reality is that the median Sales and Marketing spend compared to Net New ARR growth increased from 161% in Q1-21 to 209% in Q4-23 using the companies that had reported when this chart was created.
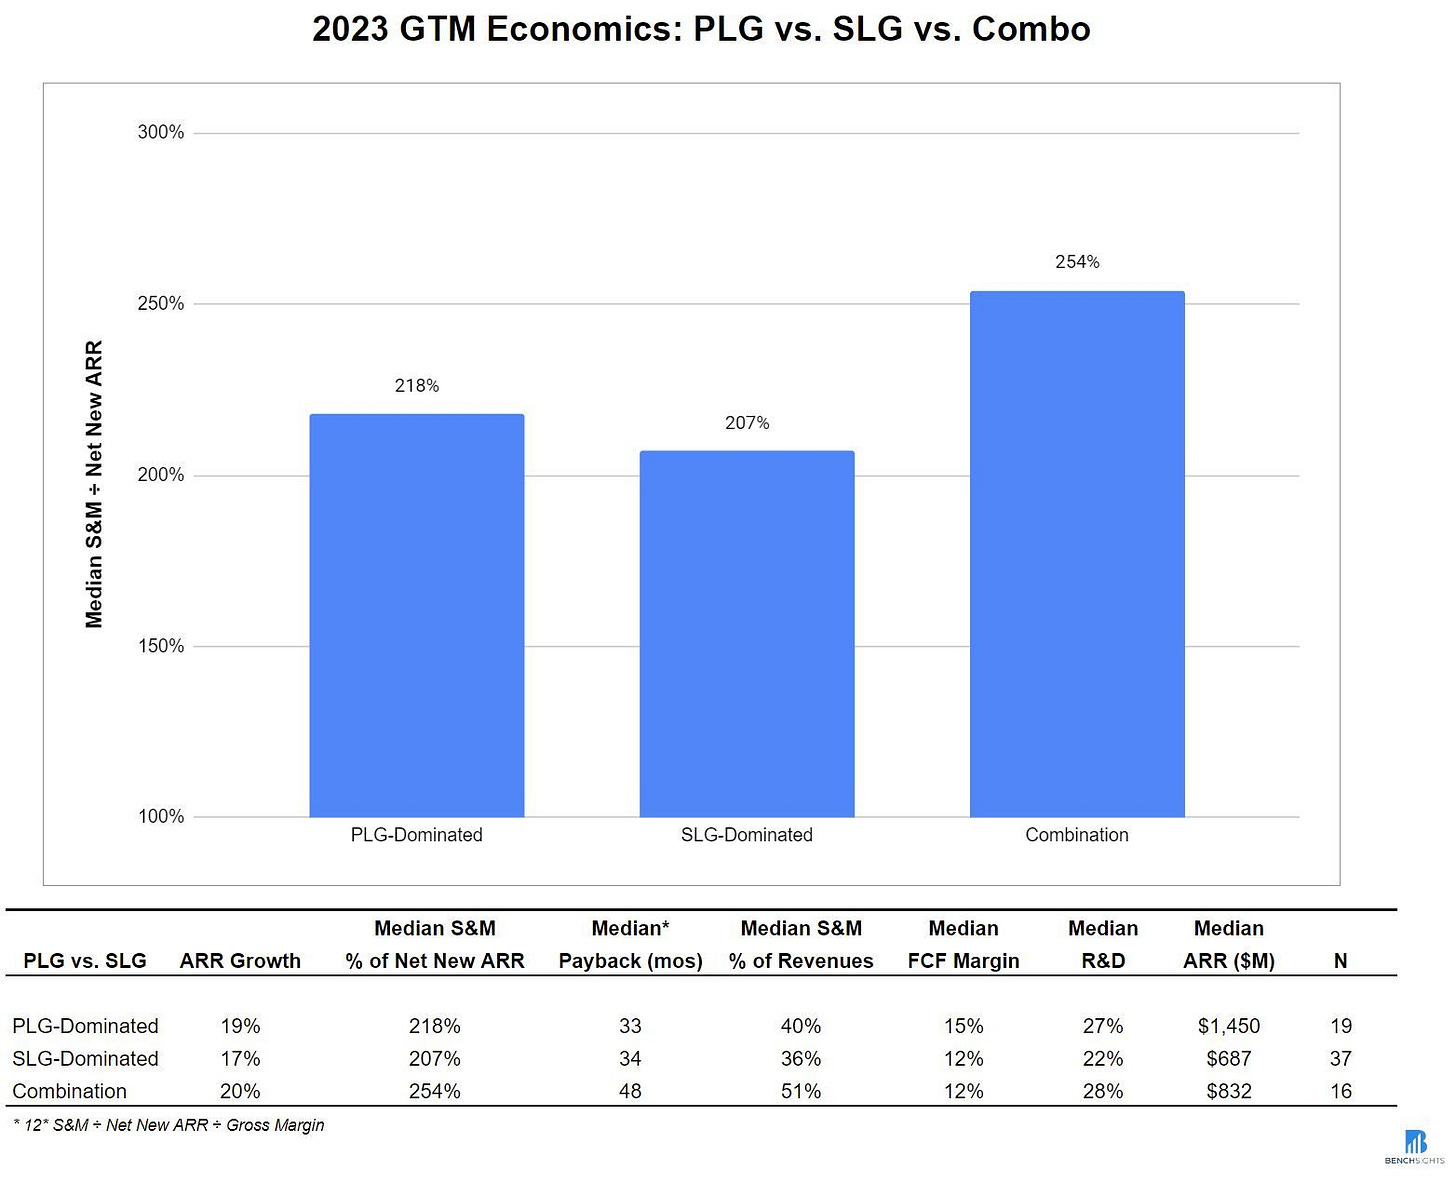
The final chart below shows the median values of Sales and Marketing expenses measured against Net New ARR across 69 public SaaS companies for all of 2023.
Source: David Spitz - Benchsights
Summary and Conclusion:
I typically refrain from providing strong opinions on what needs to be done based upon the data, trends and analysis that I conduct on the benchmarks we collect at Benchmarkit. As a long time subscription and recurring revenue software/SaaS operator, I always thought and knew it was so much easier to espouse what needed to be done versus actually doing it!
However, based upon the metrics and benchmarks trends we track, coupled with the insights I gained in 2023 from doing a deep dive into 20+ companies performance metrics and Go-to-Market processes - I am officially saying “Houston - we have a problem”. Revenue growth efficiency in the SaaS industry needs to be addressed with more innovative, new and fresh approaches to customer acquisition and expansion. Additionally, we have to realize that we have entered into the next phase of industry maturity, while we are also continuing to work out the ramifications of too much capital and too many companies in almost every category across the SaaS industry.
Of course the good news is that the next big industry wave created by Generative AI has quickly engendered the dreams and aspirations of entrepreneurs and investors alike!!!
If you are enjoying the SaaS Barometer Newsletter click here to become a Benchmarkit insider to receive preferred access to new benchmarking research, content, podcasts and events.
Benchmarkit is hosting two SaaS Solution Showcases in June featuring product demonstrations from the top solution providers in Subscription, Billing and Revenue Management AND SaaS Metrics and Analytics Reporting!
Click here to gain your free virtual pass to see the latest innovations in these two critical, continuously evolving SaaS product categories


