

B2B SaaS Benchmarks 2022 Report
Four Noteworthy Findings and Key Performance Data from the B2B SaaS Benchmarks 2022 Report - an informational foundation for the 2023 Report being released in June!
We are preparing to release the industry’s largest private company, B2B SaaS Benchmark Report the first week of June, which includes data from 2,000+ companies. As a precursor to the 2023 Benchmark report release, I thought it might be interesting to revisit some of the highlights from the 2022 report.
RevOps Squared partnered with leading B2B SaaS vendors, CFO outsourcing companies, and advisory services firms including Sage Intacct, Mosaic, and The SaaS CFO to collect valuable data from 878 private B2B SaaS companies. This data encompasses key performance metrics across various categories, providing essential benchmarks for your company's growth and success.
Let’s take a look at some data from the B2B SaaS Benchmarks 2022 Report!
Noteworthy Findings
Here are the four most noteworthy findings from the 2022 report:
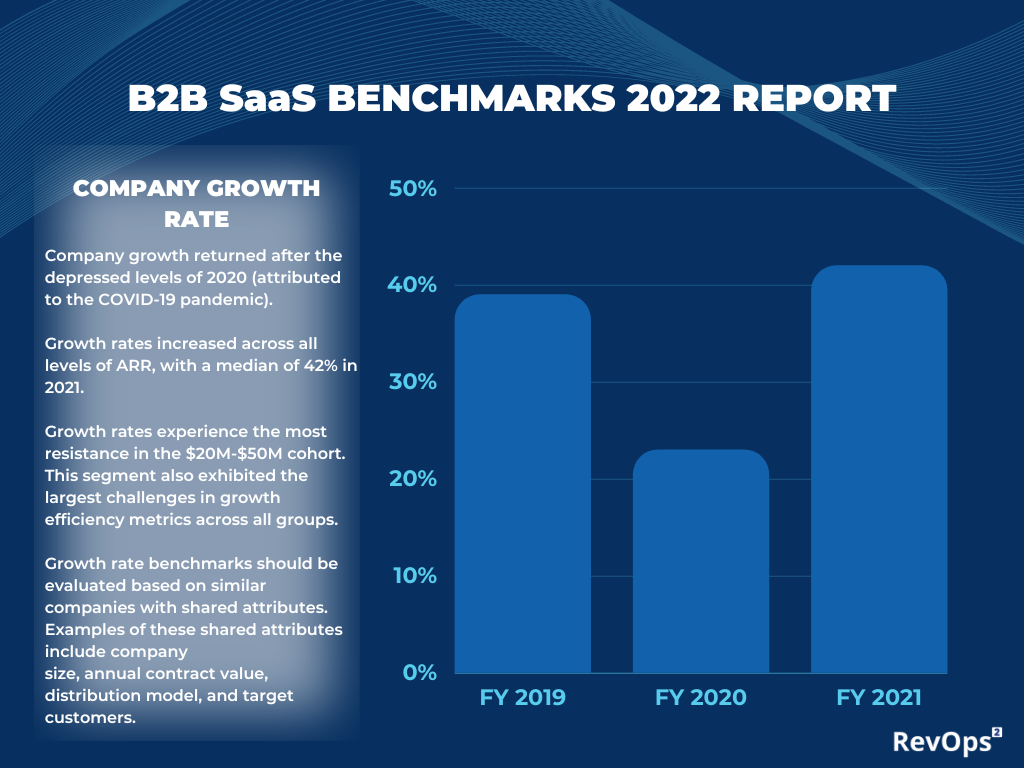
CARR Growth Rates: Median CARR growth rates in CY-21 experienced significant growth, surpassing the benchmarks from the two previous years. The growth rate for the total population reached a median of 42%, reflecting the industry's accelerated momentum.

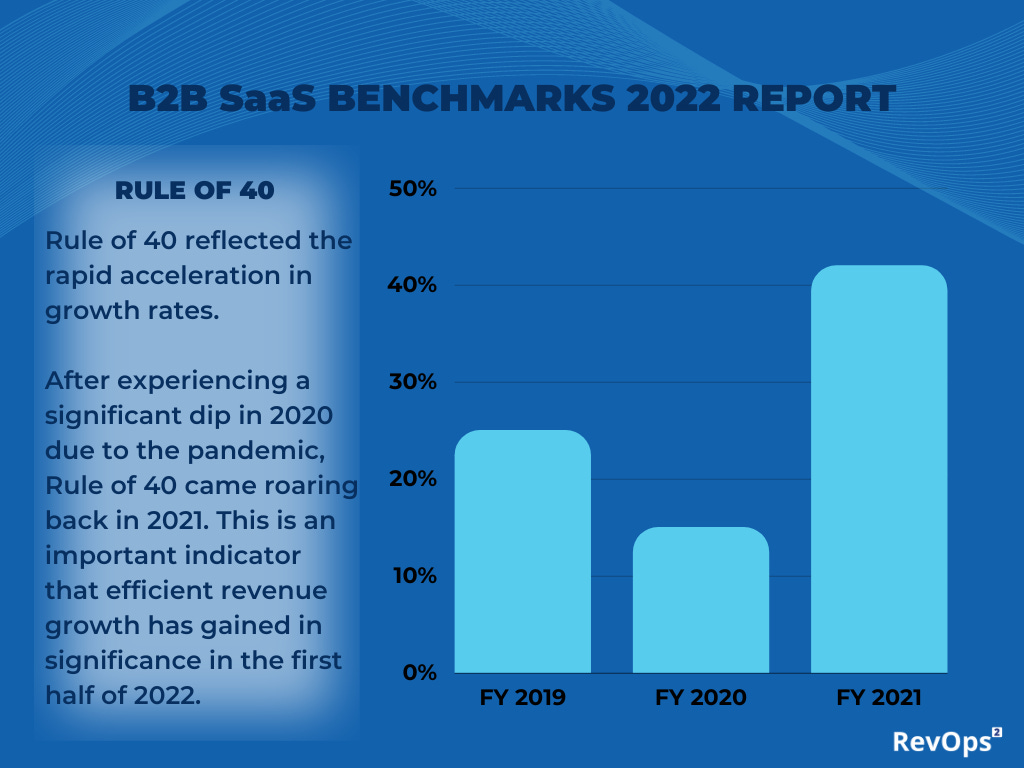
2. Rule of 40: After a dip in 2020 due to the pandemic, the Rule of 40 started a comeback in CY-21, which has continued into 2023. This indicates that efficient revenue growth has regained a heightened importance, reflecting the industry's resilience and adaptability.

3. CAC Payback Period: Across the entire population, the CAC Payback Period decreased by three months compared to the previous year. It also improved by two months compared to the previous year’s median of 18 months. This positive trend emphasizes the increase in revenue growth efficiency.

4. Gross & Net Dollar Retention Rates: Net Dollar Retention rates continued to increase slightly year-over-year, while Gross Dollar Retention rates remained flat for the third consecutive year. The continued growth in Net Dollar Retention reflects the industry's focus on maximizing lifetime customer value and the rise of "product-led growth" and "usage-based pricing" strategies.


B2B SaaS Benchmarks 2022 Report: Data Collection and Segmentation
The collected data includes 15 metrics grouped into five categories: Capital Efficiency, Operational Efficiency, Customer Acquisition Efficiency, Customer Expansion Efficiency, and Customer Retention Efficiency. To provide comprehensive insights, the data has been segmented into cohorts based on various company profiles, such as Company Size, Average Annual Contract Value, Distribution Model, Target Customer Market, Solution Type, Go-To-Market Motion, Primary Financing Source, and Company HQ location. It's important to note that all the data has been anonymized, aggregated, and normalized to exclude any outliers that deviate more than two standard deviations from the mean.
Historical Benchmarks and Interactive Benchmarking
To offer context, we included select historical benchmarks from 2021, 2020, and 2019. These benchmarks provide a snapshot of industry trends and performance over time. Additionally, we invite you to explore more granular and context-based benchmarks through our interactive session at SaaSKPIBenchmarks.com. Also included are benchmarks across multiple other categories including Pipeline Performance, Customer Success, Financial Operations, Account-Based program and many more. This site allows for a deeper dive into specific metrics, their benchmarks and the implications and opportunities for your company.
The Value of Cohort-Based Benchmarks
We believe that comparing key performance indicators (KPIs) across "like" companies is an essential evolution in B2B SaaS benchmarking. Cohort-based benchmarks take into account a variety of factors that best reflect each company's unique situation. Such benchmarks are crucial when preparing for a financing event, presenting company performance to investors and board members, and establishing measurable goals and KPIs that align with the executive team's vision.
We extend our gratitude to our research partners for their efforts in gathering these benchmarks. We are also thankful to the companies that invested their valuable time in contributing their metrics to the benchmarking process.
Stay Informed and Drive Success
We hope our benchmarking research provides valuable insights for your company's growth strategy, financial planning, and executive decision-making. By understanding industry trends and comparing KPIs with like-minded companies, you can align your goals and drive success.
If you'd like to explore the complete set of benchmarks, you can all of the benchmarks by cohort are available at SaaSKPIBenchmarks.com.
If you would like to receive an early release of the 2023 B2B SaaS Benchmark Report to be published in June, send an email to: rayrike@revopssquared.com.