

AI Metrics that Matter - in 2025
“How companies are measuring AI product performance”

This week’s SaaS Barometer Newsletter is brought to you by Drivetrain 'Every finance leader right now is wondering: "What does AI mean for my team?"
Forward-thinking CFOs are already using AI to speed up modelling, surface insights that humans might miss, and free up time for strategic work.
Drivetrain AI is redefining planning and analysis. Drivetrain’s autonomous agents can build models in minutes, transform data in seconds, detect anomalies instantly, and so much more.
Introduction
AI companies — whether building native applications or training LLMs — can move fast and break things, but they can’t afford to guess when it comes to user engagement, model performance and the projected ROI that supports their capital intensive investments.
The most successful leaders obsess over metrics that span financial health, product performance, customer engagement, and go-to-market execution.
Below is an initial high level summary of AI company and product metrics that matter, and that I will be enhancing, refining and sharing on a regular basis as the AI software industry quickly changes and evolves.
1️⃣ Financial Performance Metrics
These metrics ensure leadership and investors alike have insights into the commercial viability, sustainability and longer term profitability of AI product investments.
Annual Recurring Revenue (ARR):
Many traditional SaaS companies segment ARR into AI-specific vs non-AI product streams to understand the incremental impact of AI investments. Though not for this edition of the newsletter - be very careful NOT to count paid pilots or proof of concepts as ARR, with a conversion rate of less than 50% from POCs/Pilots to production this can materially inflate the true nature of ARR in AI products.
ARR Growth:
Growing ARR to $100M used to be measured in years, but is now being measured in months, as highlighted by the Lovable growth to $100M ARR in 8 months! Growing to $100M in 8 - 24 months is still the exception…even in AI-native companies.
The more normal Native-AI company growth rate, which in the recently published Bessemer Venture Partners State of AI in 2025 report, categorized the majority of AI-native companies as “Shooting Stars”. The report introduced a new acronym to define AI-native company growth expectations, which replaces T2D3 (Triple, Triple, Double, Double, Double), the acronym to define expected, early stage SaaS company growth. The new acronym to highlight ARR growth expectations for AI-native companies is Q2T3 (quadruple, quadruple, triple, triple, triple).
You can hear more about AI-Native companies growth on a recent SaaS Talk with the Metrics Brothers episode “The New AI Growth Metric: Months to $100M ARR”.
AI Product Revenue Contribution:
The metric measures the percentage of total revenue attributable to AI-powered features or AI products. This metric highlights how much the AI product is driving upsells, new business, or retention. It is also important to begin the categorization of not only AI product revenue, but also the associated AI product specific Cost of Goods Sold and Operating Expenses.
AI Product Cost of Goods Sold:
An AI product's Cost of Goods Sold (COGS) is defined as the direct costs to deliver your AI product or service to customers. AI product COGS are typically greater than in a legacy SaaS company, with COGS representing 35% to 50% of AI product revenue versus 15% - 30% of traditional SaaS product revenue. As such it will be critical to understand and report on how AI product specific gross margins are impacting the overall company gross margin.
An AI products’ Cost of Goods Sold includes costs above and beyond a legacy SaaS product such as 3rd party LLM inference costs, model hosting, customer specific model training and third-party API usage. Tracking AI-specific gross margin is essential to avoid runaway LLM inference, customer specific model training, model monitoring and human reinforcement/moderation costs. In fact, many AI products should come with guardrails that serve to control runaway cost of goods sold.
AI-Native product gross margins (Revenue - COGS)/Revenue benchmarks are in the range of 50% - 65% while traditional SaaS companies gross margin benchmarks are in the 70% - 85% range. In fact, the Bessemer State of AI 2025 report highlights that the fastest growing AI-Native companies - or as they call them “Super Novas” typically have gross margins in the ~ 25% range as they trade off gross profit for user adoption and engagement.
Dave “CAC” Kellogg and Ray “Growth” Rike discuss this topic on the latest episode of SaaS Talk with the Metrics Brothers entitled: The Gross Margin of AI Products.
Opex % of Revenue for AI R&D:
Measures how much operating expense is allocated to ongoing AI model development, which includes the actual software development, initial model training, DevOps and on-going model fine tuning.
2️⃣ AI Product Performance Metrics
The health of the AI product or model directly influences adoption, retention, and cost efficiency. I have gone a little more in-depth in this section, as these are very AI product–specific measurements, and they represent some of the more resource- and capital-intensive aspects of AI products that are not typically measured in a traditional SaaS business.
Model Accuracy / Relevance Score:
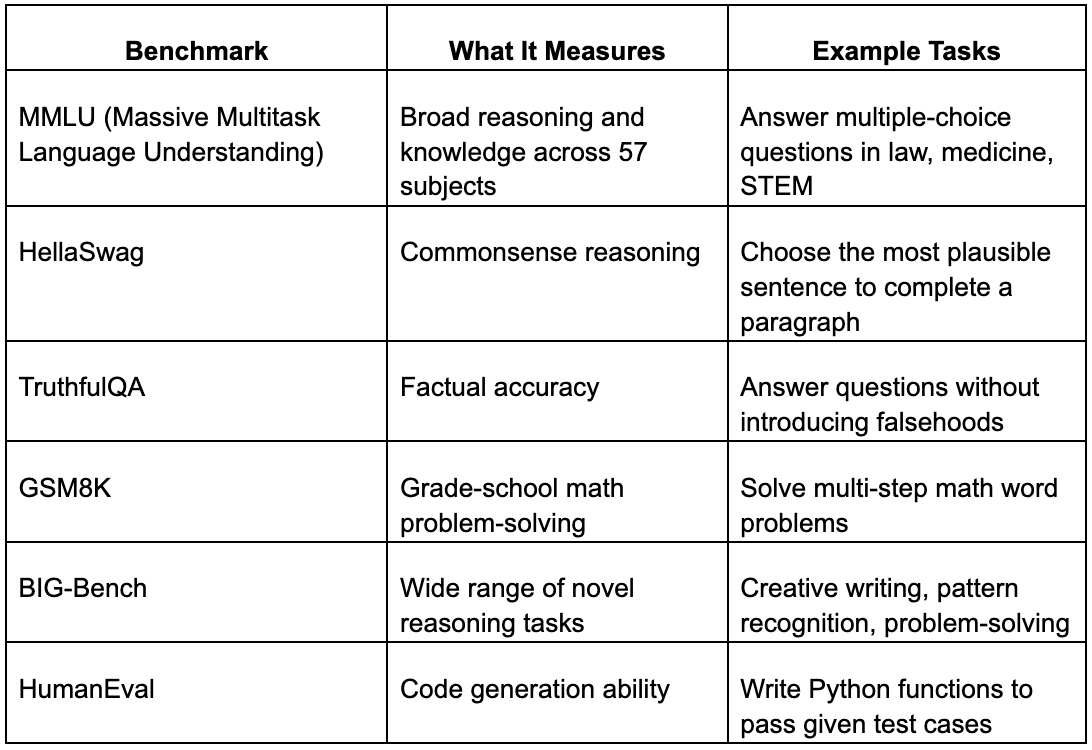
Task-specific performance measures like the F1 score, BLEU score, or retrieval precision. Native AI apps tie accuracy to end-user tasks, while LLM providers focus on benchmark test suites including
Some common AI benchmarking tests are included in the table below:
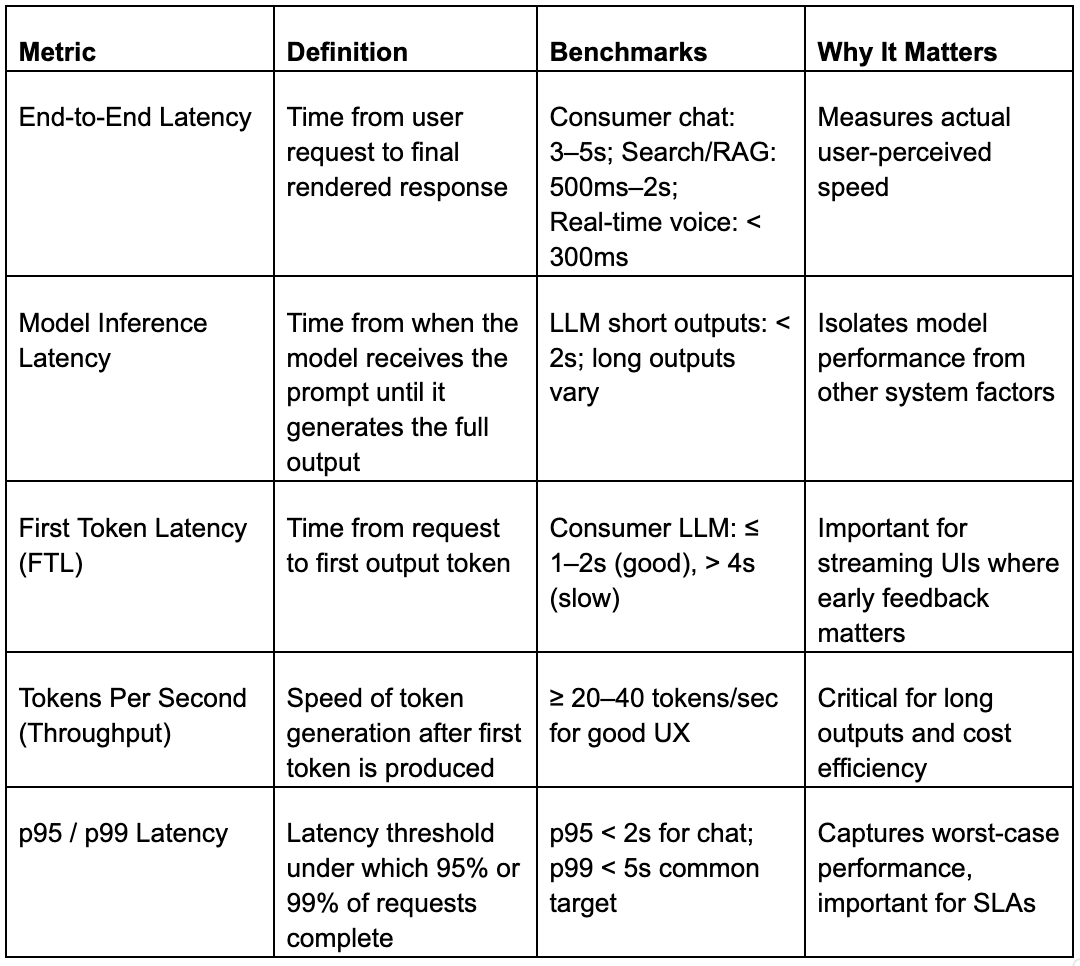
Latency / Response Time:
Average time between a user request and the AI output. For LLM providers, latency directly impacts throughput and infrastructure cost, while for user-facing apps, slow responses kill engagement.
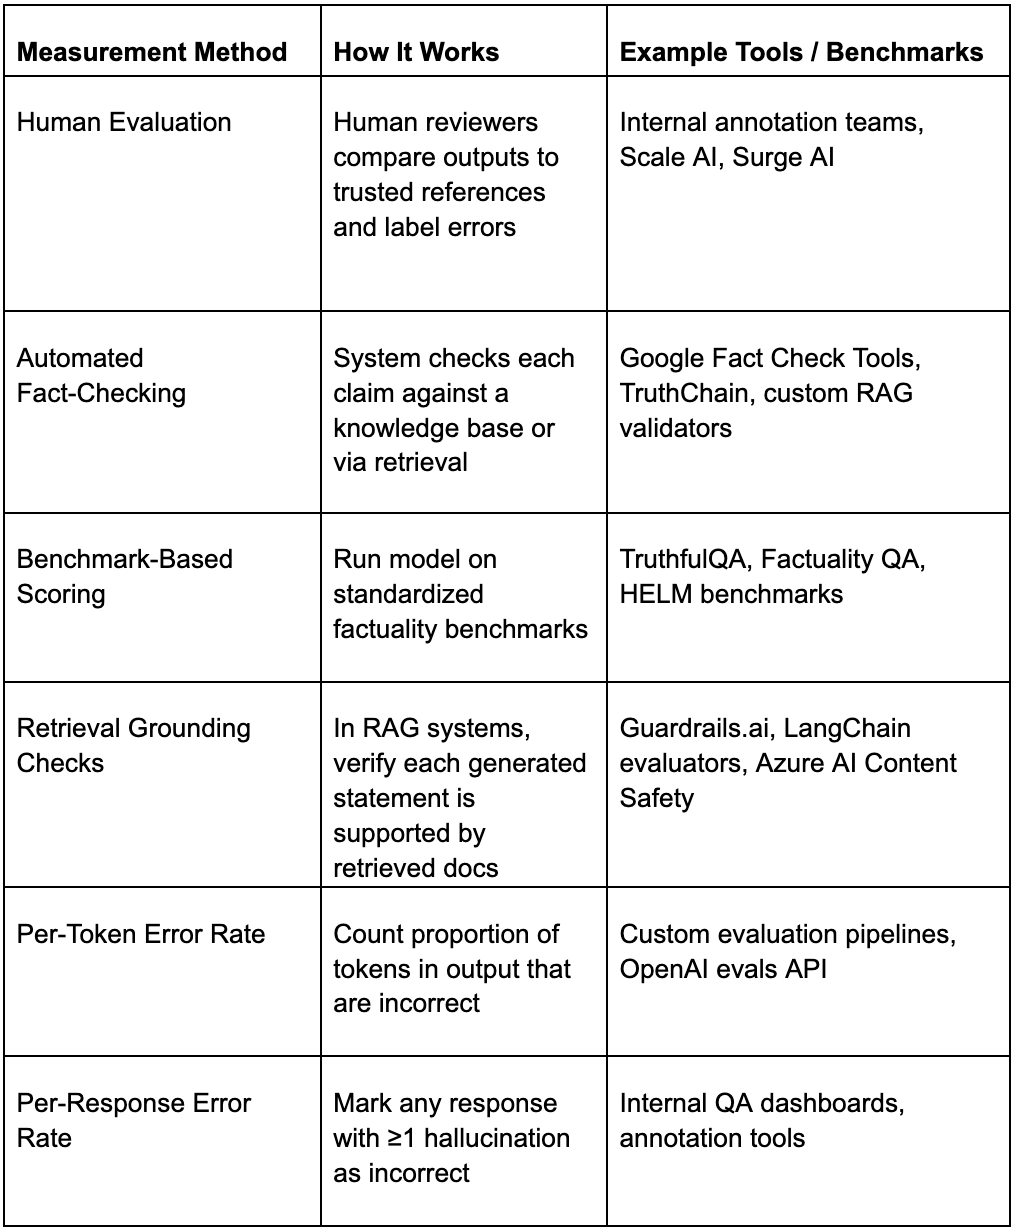
Hallucination / Error Rate:
The percentage of AI outputs that are factually wrong or logically flawed. Below are some of the measurement methods used to test model accuracy.
3️⃣ Customer Satisfaction or Engagement Metrics
AI adoption is meaningless if customers don’t find sustained value.
AI Feature Adoption Rate:
The percentage of active customers using at least one AI-powered feature. Signals whether AI capabilities are compelling or just “nice-to-have.”
Engagement Depth:
Measures how often and how extensively customers use AI features — e.g., average queries per user per month, or % of workflows completed with AI assistance.
Net Promoter Score (NPS) for AI Features:
A targeted NPS that asks specifically about AI features rather than the overall product. Helps isolate AI’s impact on brand loyalty.
4️⃣ Go-to-Market Metrics
Even the most advanced AI product fails without effective distribution and sales execution.
Proof of Concept (POC) / Pilot Conversion Rate:
A large majority of new AI product implementations start with a proof of concept or pilot program. Per multiple industry sources including AYADATA over 70% of AI proof of concepts (POCs) convert to production, and over 88% never move into full production. In the ICONIQ State of GTM 2025 report, they reported that 43% of AI “free” POCs convert to paid programs, but the report did not go into detail on if the paid program was equal to full production.
Win Rate in AI-Influenced Deals:
The percentage of competitive deals won where AI functionality was a decision factor. Helps GTM teams understand competitive advantage.
It will be VERY important with win rate to clearly define the difference between Win Rate that goes to a POC/Pilot versus the Win Rate and/or conversion rate to a full paid production deployment.
Sales Cycle Length for AI Deals:
Average time from lead to close for AI-specific opportunities. AI capabilities can both shorten cycles (clear ROI) or lengthen them (complex compliance/security reviews).
Same caution with the Win Rate metric - critical to define the sales cycle length differences between a POC/Free Pilot and a paying, production customer.
Expansion Revenue / Net Revenue Retention (NRR):
Shows how AI features drive upsells and cross-sells. Moreover, many AI centric products are being priced on a usage or outcome basis, and it will be very important to categorize and report on expansion ARR from incremental usage versus a more traditional up-sell or cross-sell opportunity.
Why Understanding AI Specific Metrics Matters
Over 80% of traditional SaaS companies report they have introduced at least one AI product. Currently ~50% are charging separately for their AI products, while 48% have prioritized AI product adoption over monetization. Native AI applications tend to emphasize adoption, engagement, and expansion metrics even more than traditional SaaS products, because pricing and thus revenue growth is more often tied directly to sustained usage of AI features.
LLM providers prioritize accuracy, latency, and gross margin — because their revenue scales with usage, and cost-to-serve is often the biggest profitability lever.
Across the board, companies that link financial, product, customer, and GTM metrics into a single dashboard can act faster, allocate resources better, and scale with confidence. But beware, as the metrics we have all become so used to in the SaaS industry are evolving in the AI software world—especially in product performance, cost of goods sold, and the use of proof of concepts before converting to full production and thus legitimate ARR!!!
SaaS Metrics Palooza ‘25 is back for a fourth year. This is the largest industry event dedicated 100% to the sharing of best practices of how metrics and benchmarks are being used by both operators and investors to drive decisions and increase performance.
Due to popular demand, we are also hosting an in-person event in San Francisco on Tuesday, September 16th called “SaaS Metrics Executive Summit”.