


2025 B2B SaaS Marketing Benchmarks
“How much should we invest in Marketing…and where???”

This week’s SaaS Barometer Newsletter is brought to you by LiveFlow. Spreadsheet-native FP&A has never been easier thanks to LiveFlow. Connect QuickBooks Online or Xero to Excel, and join thousands of teams delivering accurate, automated insights 24/7. Trusted by teams from Y Combinator to Crumbl Cookies—book a demo today!
2025 B2B SaaS Marketing Benchmarks
“How much should we invest in Marketing…and where???”
The quote “Half the money I spend on Marketing is wasted; the trouble is I don't know which half” has never been truer for B2B SaaS marketers than in 2025. When you factor in all the talk and noise around Product-Led Growth, Media-Lead Growth, Community-Lead Growth, Content-Led Growth coupled with continued challenges with pipeline development it has never been more difficult to determine the best Marketing investments or even how much where!?!
If you are a Chief Marketing Officer responsible for deciding how much and/or where best to allocate Marketing investment, or a CEO or CFO responsible for ensuring every dollar invested provides the desired…dare I say required return on investment, today’s SaaS Barometer Newsletter is for you!
Based upon ground-breaking, original benchmarking research conducted in partnership with Chief Marketing Officers that helped shape B2B SaaS Marketing as we know it including:

I am pleased to dedicate this SaaS Barometer Newsletter to highlight the key findings in the 2025 B2B Marketing Budget and Productivity Benchmarks Report.
Marketing Budget as a Percentage of Total Sales and Marketing Budget
Traditional wisdom suggests the combined Marketing and Sales budget should be in the 30% to 50% of revenue range, with company stage and size being a primary variable to determine when 30%-35% of revenue becomes the desired target for the combined Sales and Marketing investment.
The split between Sales and Marketing has historically been ~ 30% Marketing and ~ 70% Sales. Below is the benchmark chart breaking down the 2025 annual budget allocated to Marketing, segmented by Annual Contact Value:
Marketing Budget as % Total Sales and Marketing Budget By Average Contract Value
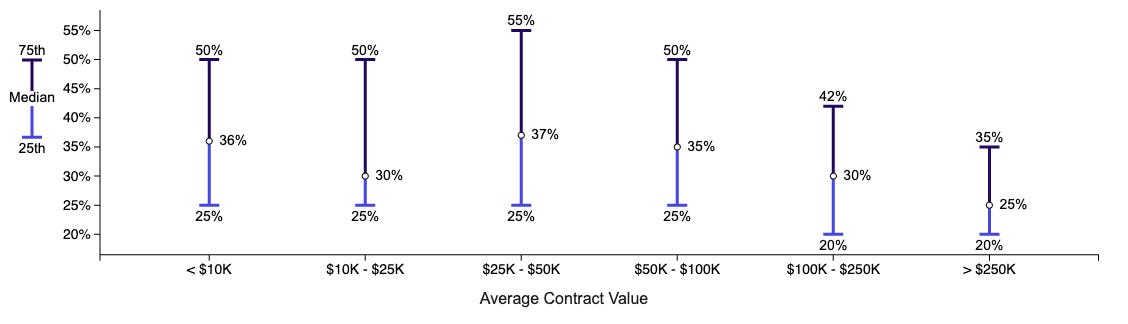
Source: Benchmarkit 2025 B2B Marketing Benchmarks Report
The allocation between Marketing and Sales is impacted by company size, Go-to-Market Motion and distribution model. If you are interested in seeing the benchmarks interactively and using filters, you can click here to see and filter the 2025 interactive B2B Marketing benchmarks.
B2B Marketing Budget as a Percentage of Revenue (’24 vs ’25)
The majority of B2B SaaS companies use “percent of revenue” as a guideline for how much budget to allocate to Marketing. They then view that in context of last year’s Marketing expenses and the most recent Marketing expense trends to further refine the Marketing budget for the next fiscal year. Below is a chart that shows the benchmarks for both 2024 actuals and the 2025 planned Marketing budget as a percentage of revenue – segmented by company size (revenue).

Source: Benchmarkit 2025 B2B Marketing Benchmarks Report
As you can see in the chart above, in this research the percent of revenue allocated to Marketing decreases at each stage of growth with the notable exception of the $50M - $100M segment. This increase in the $50M - $100M range is often a result of companies attempting to expand their target addressable market by entering new markets or new geographies in search of growth.
It is interesting to note that in 2025, most companies are increasing their Marketing budgets slightly, with a 1% increase in companies < $20M and a 1% increase in companies in the $100M - $250M revenue range. This is consistent with the gradual return to growth mentality that we are seeing across the board, especially in the strongest cohort of B2B SaaS companies.
People vs Programs vs Technology Budget Allocation
A common Marketing budget allocation model used is to bucket investments into people, programs and technology. The people component includes the fully burdened cost of Marketing employees including salary, bonus and benefits.
Programs include all of the expenses, often variable in nature related to the different programs and 3rd party agencies leveraged such as demand generation, events, search engine optimization, paid media, content marketing, channel/partner marketing and brand.
Technology, which includes the infrastructure that Marketing teams deploy to automate, measure and report on program and channel performance is expanding to include the AI tools being used.
Below is a chart highlighting the People/Program/Technology allocation benchmarks segmented by company size:
Marketing Budget (%) Allocated to Programs - Mean By Annual Revenue

Source: Benchmarkit 2025 B2B Marketing Benchmarks Report
Of note in the above chart is that as companies scale beyond $20M, the percentage of the Marketing budget allocated to Demand Generation increases at each stage up to $100M ARR, and then begins to decrease at the same time investments in events increase.
Product-Led Growth Benchmarks Yield Different Results
Product-Led Growth (PLG) is defined as the process by which customer acquisition and expansion is facilitated by a combination of outbound Marketing and the product itself to target, on-board and engage users without the assistance of sales resources. A common strategy used is to offer a no-cost (freemium) product with reduced functionality to entice the user to first try and then upgrade to a paid version of the product to unlock additional features and function.
Very successful companies have been built using a PLG first strategy, including Atlassian, Zendesk, and Slack whose Marketing teams were led by our research partners. There are a few key differences in how much PLG teams allocate to Marketing and how that increased budget is allocated between people, programs and technology.
Charts that highlight the PLG Marketing benchmarks are below:
Marketing Budget Allocation (Mean)
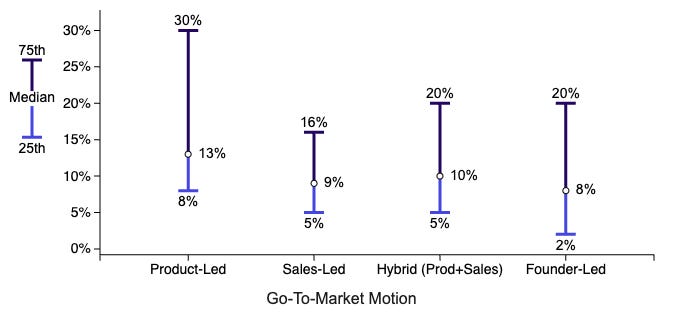
Source: Benchmarkit 2025 B2B Marketing Benchmarks Report
Product-Led Growth companies are investing a median of 13% of revenue on Marketing in contrast to 9% for Sales-Led and 10% for Hybrid Go-to-Market motions. This makes sense since the primary customer acquisition activities are empowered by Marketing programs and within the product itself, significantly reducing the need for Sales resources during the initial part of the customer journey. Another interesting difference is where the Marketing budget is allocated in PLG companies per the chart below:

Source: Benchmarkit 2025 B2B Marketing Benchmarks Report
The above chart highlights that PLG companies allocate significantly more budget to programs (52%) versus Sales-Led Growth (44%). This increase in program investment is funded by a reduced budget to people (32% vs 44%) along with an increase in technology investment at 16% mean versus 13% in Sales-Led Growth companies.
Marketing Attribution Benchmarks – Maturity Makes a Difference
Marketing attribution is an intensely debated topic, nonetheless it is an often used tactic to measure the ROI of Marketing expenses by program and channel, though we will save the discussion on the merits of attribution for another newsletter. Below highlights how the type of Marketing attribution used evolves as companies scale:

Source: Benchmarkit 2025 B2B Marketing Benchmarks Report
As the benchmarks above highlight, as a company grows the attribution model moves from multi-touch in the early days, since there are much fewer touches to monitor and evolves to first looking at the impact of inbound leads, evolving to last touch, then first touch and then to multi-touch attribution.
Marketing Performance and Productivity Measurements – When will Marketing ROI become a priority
Do you want the good news or the bad news first? Hoping to retain your attention just a little longer, let’s start with the good news. Vanity metrics, such as website visitors and content downloads are much lower priorities and outcomes including pipeline and the number of opportunities are both top three Marketing measurements. Take a look at the benchmark chart below:

Source:Benchmarkit 2025 B2B Marketing Benchmarks Report
It is encouraging to see that the top 3 Marketing performance measurements are the outcomes measured by pipeline dollars generated (62% ranked in top 3), pipeline opportunities generated (51% ranked top 3) and New ARR (36% ranked top 3). At the same time, in an era of revenue growth efficiency, it was disappointing to see that the majority of Marketing departments are not measuring the efficiency of the outcomes. Efficiency is defined as the cost of inputs required to produce the desired outputs – in this case New ARR. Marketing CAC Ratio is the best metrics to measure Marketing efficiency – but before we define that let’s look at the benchmarks:

Source: Benchmarkit 2025 B2B Marketing Benchmarks Report
On a positive note, a majority (52%) of Marketing departments are measuring the cost per dollar of pipeline generated, 48% are measuring the cost per opportunity and 48% are measuring Marketing investment per New ARR dollar closed!
As SaaS companies continue to increase the focus on existing customer expansion ARR, it is a best practice for Marketing organizations to also measure the efficiency of the Marketing investment on expansion ARR. This is a little easier in companies that have established a Growth Marketing function, but can easily be directionally measured by identifying which percentage of people and programs is targeted at existing customer expansion marketing versus on new customer logo acquisition.
Earlier in the newsletter we mentioned the value of measuring the Marketing CAC Ratio. It is a fairly simple metric to calculate, as it measures how much total New ARR is generated from every dollar of Marketing expenses. The Marketing CAC Ratio formula is below:

Below are the 2025 Marketing CAC Ratio Benchmarks for companies up to $100M:

Source: Benchmarkit 2025 B2B Marketing Benchmarks Report
The above benchmark chart highlights that as a company grows, the Marketing CAC Ratio also decreases from a median of $1.03 in Marketing expenses for every dollar of New ARR, and decreasing to $.53 in $20M - $50M range and decreases again to $.50 in Marketing expenses for every dollar of New ARR for companies in the $50M - $100M range. There were not enough companies with greater than $100M in revenue that provided their Marketing CAC Ratio to provide a statistically significant benchmark for larger B2B SaaS companies.
The above Marketing CAC Ratio benchmarks are very aligned to the overall CAC Ratio benchmarks in 2024 where companies invested ~ $1.55 in total Sales and Marketing expenses to generate $1 of New ARR. Total CAC Ratio is calculated by dividing fully loaded Sales and Marketing expenses by the Total New ARR generated in a period.
We NEED more leads - says every Sales Organization Ever!
One of the most interesting benchmarks collected was the percentage of inbound leads generated measured against growth rates. It is well known that inbound leads – those opportunities created from inbound hand raisers who requested a sales call, a demonstration or even signed up for a freemium product that converts into New ARR are highly coveted. Why – because those leads typically have a higher win rate, close faster and with a high average annual contract value.
Let’s look at the benchmarks for how the percentage of inbound leads that converted to New ARR compared to growth rates:
Growth Rate by % New ARR
from Inbound Leads
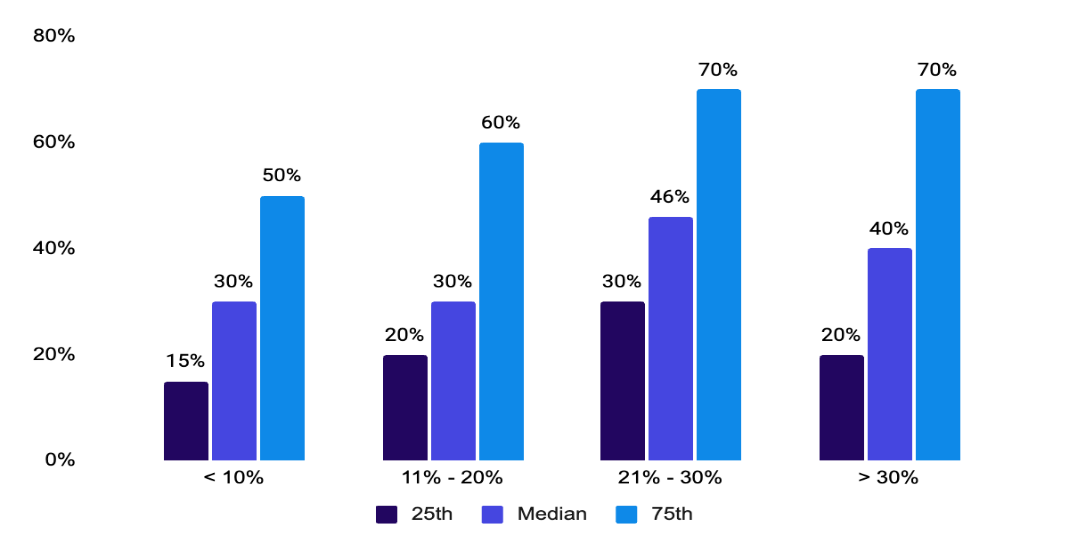
Source: Benchmarkit 2025 B2B Marketing Benchmarks Report
The above benchmark chart shows that companies with a growth rate greater than 30% have 40% (median) of their new ARR generated from inbound leads versus companies growing less than 20% only have 30% (median) of their new ARR resulting from inbound leads.
Ok, that was last year – but the 2025 planned budgets are very similar, whereas companies growing at 20% and above are planning for 40% of their New ARR as a result of Inbound Leads, versus companies planning to grow less than 20% are budgeting for ~ 30% of their new ARR to be the result of inbound leads.
The findings suggest that identifying strategies and techniques that can increase the percentage of New ARR resulting from Inbound leads will not only result in better Marketing efficiency, but also in higher growth rates which is the number one metric most impacting Enterprise Value to Revenue multiples.
Summary
Marketing is one of the most difficult organizations to manage, due to both the multiple external factors that impact its performance, and the challenge in measuring the productivity and efficiency of the specific inputs (investments) and the correlated outputs (New ARR).
With the assistance of B2B Marketing benchmarks specific to a company’s attributes, in concert with well developed Marketing efficiency metrics that highlight the trends of Marketing investments to New ARR outcomes, B2B SaaS companies can begin the journey of having predictable new and expansion ARR based upon the investments in both Marketing and Sales.
Using the guidelines of industry benchmarks in concert with internal Marketing ROI trends – the decision on how much investment to make in Marketing can become much more data-driven and predictable.
Below is your free access to all of the 2025 B2B Marketing benchmarks which can be filtered by:1) Company Revenue: 2) ACV; 3) GTM Motion; 4) Pricing Model; 5) 2024 or 2025 Growth rate:
B2B Marketing Benchmark Interactive Portal (Free Access)

If you’re eager to gain early access to the latest B2B SaaS Performance Metrics, including insights on growth rates, operating profitability, customer acquisition costs, and revenue retention, we invite you to participate in our upcoming survey. By contributing your insights, you’ll help shape the industry’s benchmarks and receive exclusive early access to the findings. Join us in uncovering how top SaaS companies are performing in 2025. Take the survey now to stay ahead of the latest trends!